JetBlue Airlines 2011 Annual Report Download - page 49
Download and view the complete annual report
Please find page 49 of the 2011 JetBlue Airlines annual report below. You can navigate through the pages in the report by either clicking on the pages listed below, or by using the keyword search tool below to find specific information within the annual report.-
 1
1 -
2
-
3
-
4
-
5
-
6
-
7
-
8
-
9
-
10
-
11
-
12
-
13
-
14
-
15
-
16
-
17
-
18
-
19
-
20
-
21
-
22
-
23
-
24
-
25
-
26
-
27
-
28
-
29
-
30
-
31
-
32
-
33
-
34
-
35
-
36
-
37
-
38
-
 39
39 -
 40
40 -
 41
41 -
 42
42 -
 43
43 -
 44
44 -
 45
45 -
 46
46 -
 47
47 -
 48
48 -
 49
49 -
 50
50 -
 51
51 -
 52
52 -
 53
53 -
 54
54 -
 55
55 -
 56
56 -
 57
57 -
 58
58 -
 59
59 -
60
-
61
-
62
-
63
-
64
-
65
-
66
-
67
-
68
-
69
-
70
-
71
-
72
-
73
-
74
-
75
-
76
-
77
-
78
-
79
-
80
-
81
-
82
-
83
-
84
-
85
-
86
-
87
-
88
-
89
-
90
-
91
-
92
-
93
-
94
-
95
-
96
-
97
-
98
-
99
-
100
-
101
-
102
-
103
-
104
-
105
-
106
-
107
-
108
-
109
-
110
-
111
-
112
-
113
-
114
-
115
-
116
-
117
-
118
-
119
-
120
-
121
-
122
-
123
-
124
-
125
-
126
-
127
-
128
-
129
-
130
-
131
 |
 |

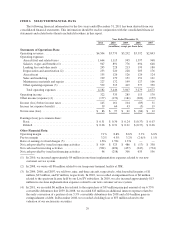
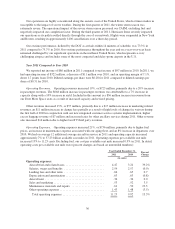
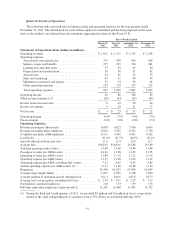
per available seat mile increased 6% in 2010. In detail, operating costs per available seat mile were (percent
changes are based on unrounded numbers):
Year Ended December 31, Percent
Change2010 2009
(in cents)
Operating expenses:
Aircraft fuel and related taxes ......................... 3.21 2.91 10.6%
Salaries, wages and benefits .......................... 2.57 2.38 7.6
Landing fees and other rents .......................... .65 .65 (0.1)
Depreciation and amortization ......................... .63 .70 (9.8)
Aircraft rent ....................................... .36 .39 (6.0)
Sales and marketing ................................. .52 .46 11.5
Maintenance materials and repairs ..................... .50 .46 8.2
Other operating expenses ............................. 1.48 1.29 15.1
Total operating expenses ........................... 9.92 9.24 7.4%
As part of our IT investments during 2010, we have had a shift in costs from depreciation expense to other
operating expenses. Additionally, the severe winter weather during 2010, both in February and December,
created unexpected cost pressures.
Aircraft fuel expense increased 18%, or $170 million, due to a 10% increase in average fuel cost per gallon,
or $104 million after the impact of fuel hedging and 31 million more gallons of aircraft fuel consumed, resulting
in $66 million of higher fuel expense. We recorded $3 million in effective fuel hedge losses during 2010 versus
$120 million during 2009. Our average fuel cost per gallon was $2.29 for the year ended December 31, 2010
compared to $2.08 for the year ended December 31, 2009. Our fuel costs represented 32% and 31% of our
operating expenses in 2010 and 2009, respectively. Based on our expected fuel volume for 2011, a 10% per
gallon increase in the cost of aircraft fuel would increase our annual fuel expense by approximately $130 million.
Cost per available seat mile increased 11% primarily due to the increase in fuel prices.
Salaries, wages and benefits increased 15%, or $115 million, due to an increase in average full-time
equivalent employees, increased wages and related benefits for several of our large workgroups implemented
between June 2009 and throughout 2010. We also had higher salaries, wages and benefits as a result of premium
time related to the severe winter storms in the Northeast both in early and late 2010. The increase in average full-
time equivalent employees is partially driven by additional staffing levels in preparation for our new customer
service system implementation in January 2010, which resulted in an additional $9 million of expense, as well as
our policy of not furloughing employees. Cost per available seat mile increased 8% primarily due to an increase
in full-time equivalent employees.
Landing fees and other rents increased 7%, or $15 million, due to a 5% increase in departures over 2009,
which includes the effects of expanded operations in certain markets and the opening of three new cities in 2010
as well as an increase in average landing fee and airport rental rates. Cost per available seat mile remained
relatively unchanged.
Depreciation and amortization decreased 4%, or $8 million. Purchased technology related to our LiveTV
acquisition became fully amortized in late 2009, resulting in reduced amortization expense in 2010. The reduced
amortization expense was offset by an increase in depreciation expense as we had an average of 97 owned and
capital leased aircraft in 2010 compared to 93 in 2009. Additionally, we had increased software amortization in
2010 related to our new customer service system. Cost per available seat mile decreased 10% due to purchased
technology becoming fully amortized and less owned computer hardware resulting from changes to our IT
infrastructure.
39