JetBlue Airlines 2011 Annual Report Download - page 46
Download and view the complete annual report
Please find page 46 of the 2011 JetBlue Airlines annual report below. You can navigate through the pages in the report by either clicking on the pages listed below, or by using the keyword search tool below to find specific information within the annual report.-
 1
1 -
2
-
3
-
4
-
5
-
6
-
7
-
8
-
9
-
10
-
11
-
12
-
13
-
14
-
15
-
16
-
17
-
18
-
19
-
20
-
21
-
22
-
23
-
24
-
25
-
26
-
27
-
28
-
29
-
30
-
31
-
32
-
33
-
34
-
35
-
 36
36 -
 37
37 -
 38
38 -
 39
39 -
 40
40 -
 41
41 -
 42
42 -
 43
43 -
 44
44 -
 45
45 -
 46
46 -
 47
47 -
 48
48 -
 49
49 -
 50
50 -
 51
51 -
 52
52 -
 53
53 -
 54
54 -
 55
55 -
 56
56 -
57
-
58
-
59
-
60
-
61
-
62
-
63
-
64
-
65
-
66
-
67
-
68
-
69
-
70
-
71
-
72
-
73
-
74
-
75
-
76
-
77
-
78
-
79
-
80
-
81
-
82
-
83
-
84
-
85
-
86
-
87
-
88
-
89
-
90
-
91
-
92
-
93
-
94
-
95
-
96
-
97
-
98
-
99
-
100
-
101
-
102
-
103
-
104
-
105
-
106
-
107
-
108
-
109
-
110
-
111
-
112
-
113
-
114
-
115
-
116
-
117
-
118
-
119
-
120
-
121
-
122
-
123
-
124
-
125
-
126
-
127
-
128
-
129
-
130
-
131
 |
 |

Our operations are highly concentrated along the eastern coast of the United States, which at times makes us
susceptible to the impact of severe weather. During the first quarter of 2011, the winter storm season was
extremely severe. The operational impact of the severe storm season pressured our CASM, excluding fuel and
negatively impacted our completion factor. During the third quarter of 2011, Hurricane Irene severely impacted
our operations as its path travelled directly through the core of our network. Flights were suspended in New York
and Boston, resulting in approximately 1400 cancellations over a three day period.
Our on-time performance, defined by the DOT as arrivals within 14 minutes of schedule, was 73.3% in
2011 compared to 75.7% in 2010. Our on-time performance throughout the year and on a year-over-year basis
remained challenged by our significant operations in the northeast United States, which represents a very
challenging airspace and includes some of the most congested and delay-prone airports in the U.S.
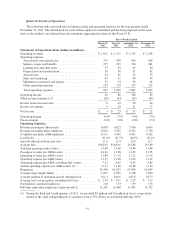
Year 2011 Compared to Year 2010
We reported net income of $86 million in 2011 compared to net income of $97 million in 2010. In 2011, we
had operating income of $322 million, a decrease of $11 million over 2010, and an operating margin of 7.1%,
down 1.7 points from 2010. Diluted earnings per share were $0.28 for 2011 compared to diluted earnings per
share of $0.31 for 2010.
Operating Revenues. Operating revenues increased 19%, or $725 million, primarily due to a 20% increase
in passenger revenues. The $668 million increase in passenger revenues was attributable to a 7% increase in
capacity along with a 10% increase in yield. Included in this amount is a $36 million increase in revenue from
our Even More Space seats as a result of increased capacity and revised pricing.
Other revenues increased 15%, or $57 million, primarily due to a $17 million increase in marketing related
revenues, an $11 million increase in change fees partially as a result of high levels of change fee waivers during
the first half of 2010 in conjunction with our new integrated customer service systems implementation, higher
excess baggage revenue of $7 million and increased rates for other ancillary services during 2011. Other revenue
also increased $14 million due to higher LiveTV third party revenues.
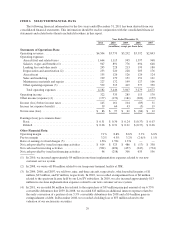
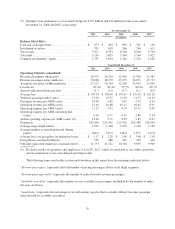
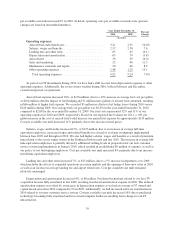
Operating Expenses. Operating expenses increased 21%, or $736 million, primarily due to higher fuel
prices, an increase in maintenance expense associated with our aging fleet, and an 8% increase in departures over
2010. We had on average 12 additional average aircraft in service in 2011 and operating capacity increased
approximately 7% to 37.23 billion available seat miles in 2011. Operating expenses per available seat mile
increased 13% to 11.23 cents. Excluding fuel, our cost per available seat mile increased 0.9% in 2011. In detail,
operating costs per available seat mile were (percent changes are based on unrounded numbers):
Year Ended December 31, Percent
Change2011 2010
(in cents)
Operating expenses:
Aircraft fuel and related taxes .......................... 4.47 3.21 39.2%
Salaries, wages and benefits ........................... 2.54 2.57 (0.9)
Landing fees and other rents ........................... .66 .65 0.7
Depreciation and amortization .......................... .63 .63 (0.8)
Aircraft rent ........................................ .36 .36 0.0
Sales and marketing .................................. .53 .52 3.5
Maintenance materials and repairs ...................... .61 .50 23.3
Other operating expenses .............................. 1.43 1.48 (3.5)
Total operating expenses ............................ 11.23 9.92 13.3%
36