JetBlue Airlines 2011 Annual Report Download - page 51
Download and view the complete annual report
Please find page 51 of the 2011 JetBlue Airlines annual report below. You can navigate through the pages in the report by either clicking on the pages listed below, or by using the keyword search tool below to find specific information within the annual report.-
 1
1 -
2
-
3
-
4
-
5
-
6
-
7
-
8
-
9
-
10
-
11
-
12
-
13
-
14
-
15
-
16
-
17
-
18
-
19
-
20
-
21
-
22
-
23
-
24
-
25
-
26
-
27
-
28
-
29
-
30
-
31
-
32
-
33
-
34
-
35
-
36
-
37
-
38
-
39
-
40
-
 41
41 -
 42
42 -
 43
43 -
 44
44 -
 45
45 -
 46
46 -
 47
47 -
 48
48 -
 49
49 -
 50
50 -
 51
51 -
 52
52 -
 53
53 -
 54
54 -
 55
55 -
 56
56 -
 57
57 -
 58
58 -
 59
59 -
 60
60 -
 61
61 -
62
-
63
-
64
-
65
-
66
-
67
-
68
-
69
-
70
-
71
-
72
-
73
-
74
-
75
-
76
-
77
-
78
-
79
-
80
-
81
-
82
-
83
-
84
-
85
-
86
-
87
-
88
-
89
-
90
-
91
-
92
-
93
-
94
-
95
-
96
-
97
-
98
-
99
-
100
-
101
-
102
-
103
-
104
-
105
-
106
-
107
-
108
-
109
-
110
-
111
-
112
-
113
-
114
-
115
-
116
-
117
-
118
-
119
-
120
-
121
-
122
-
123
-
124
-
125
-
126
-
127
-
128
-
129
-
130
-
131
 |
 |

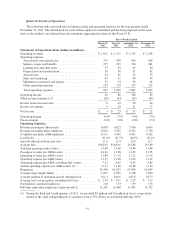
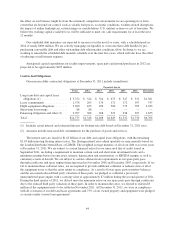
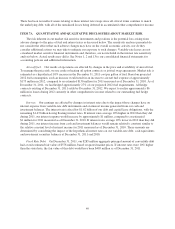
Quarterly Results of Operations
The following table sets forth selected financial data and operating statistics for the four quarters ended
December 31, 2011. The information for each of these quarters is unaudited and has been prepared on the same
basis as the audited consolidated financial statements appearing elsewhere in this Form 10-K.
Three Months Ended
March 31,
2011
June 30,
2011
September 30,
2011
December 31,
2011
Statements of Operations Data (dollars in millions)
Operating revenues .................................. $ 1,012 $ 1,151 $ 1,195 $ 1,146
Operating expenses:
Aircraft fuel and related taxes ........................ 353 439 454 418
Salaries, wages and benefits ......................... 235 235 236 241
Landing fees and other rents ......................... 57 63 65 60
Depreciation and amortization ........................ 56 58 57 62
Aircraft rent ...................................... 34 36 32 33
Sales and marketing ................................ 45 51 49 54
Maintenance materials and repairs ..................... 52 54 59 62
Other operating expenses ............................ 135 129 135 133
Total operating expenses ............................ 967 1,065 1,087 1,063
Operating income .................................... 45 86 108 83
Other income (expense) (1) ............................ (39) (43) (52) (43)
Income before income taxes ........................... 6 43 56 40
Income tax expense .................................. 3 18 21 17
Net income ......................................... $ 3 $ 25 $ 35 $ 23
Operating margin .................................... 4.4% 7.5% 9.0% 7.3%
Pre-tax margin ...................................... 0.6% 3.8% 4.6% 3.5%
Operating Statistics:
Revenue passengers (thousands) ........................ 6,039 6,622 7,016 6,693
Revenue passenger miles (millions) ..................... 6,924 7,692 8,332 7,750
Available seat miles ASM (millions) ..................... 8,511 9,441 9,855 9,425
Load factor ......................................... 81.4% 81.5% 84.5% 82.2%
Aircraft utilization (hours per day) ...................... 11.0 11.9 12.0 11.5
Average fare ........................................ $150.02 $158.01 154.88 155.60
Yield per passenger mile (cents) ........................ 13.08 13.60 13.04 13.44
Passenger revenue per ASM (cents) ..................... 10.64 11.08 11.03 11.05
Operating revenue per ASM (cents) ..................... 11.89 12.19 12.12 12.16
Operating expense per ASM (cents) ..................... 11.37 11.28 11.03 11.27
Operating expense per ASM, excluding fuel (cents) ......... 7.22 6.62 6.43 6.85
Airline operating expense per ASM (cents) (2) ............. 11.17 11.10 10.88 11.10
Departures ......................................... 56,706 61,632 63,099 62,009
Average stage length (miles) ........................... 1,075 1,091 1,108 1,090
Average number of operating aircraft during period ......... 161.4 164.6 165.8 167.9
Average fuel cost per gallon, including fuel taxes ........... $ 2.94 $ 3.31 $ 3.25 $ 3.15
Fuel gallons consumed (millions) ....................... 120 133 139 133
Full-time equivalent employees at period end (2) ........... 11,281 11,609 11,443 11,733
(1) During the third and fourth quarters of 2011, we recorded $5 million and $1 million in losses, respectively,
related to the early extinguishment of a portion of our 6.75% Series A convertible debt due 2039.
41