JetBlue Airlines 2011 Annual Report Download - page 50
Download and view the complete annual report
Please find page 50 of the 2011 JetBlue Airlines annual report below. You can navigate through the pages in the report by either clicking on the pages listed below, or by using the keyword search tool below to find specific information within the annual report.-
 1
1 -
2
-
3
-
4
-
5
-
6
-
7
-
8
-
9
-
10
-
11
-
12
-
13
-
14
-
15
-
16
-
17
-
18
-
19
-
20
-
21
-
22
-
23
-
24
-
25
-
26
-
27
-
28
-
29
-
30
-
31
-
32
-
33
-
34
-
35
-
36
-
37
-
38
-
39
-
 40
40 -
 41
41 -
 42
42 -
 43
43 -
 44
44 -
 45
45 -
 46
46 -
 47
47 -
 48
48 -
 49
49 -
 50
50 -
 51
51 -
 52
52 -
 53
53 -
 54
54 -
 55
55 -
 56
56 -
 57
57 -
 58
58 -
 59
59 -
 60
60 -
61
-
62
-
63
-
64
-
65
-
66
-
67
-
68
-
69
-
70
-
71
-
72
-
73
-
74
-
75
-
76
-
77
-
78
-
79
-
80
-
81
-
82
-
83
-
84
-
85
-
86
-
87
-
88
-
89
-
90
-
91
-
92
-
93
-
94
-
95
-
96
-
97
-
98
-
99
-
100
-
101
-
102
-
103
-
104
-
105
-
106
-
107
-
108
-
109
-
110
-
111
-
112
-
113
-
114
-
115
-
116
-
117
-
118
-
119
-
120
-
121
-
122
-
123
-
124
-
125
-
126
-
127
-
128
-
129
-
130
-
131
 |
 |
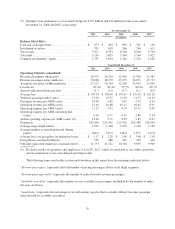
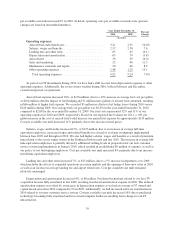
Sales and marketing expense increased 19%, or $28 million, due to $14 million in higher credit card fees
resulting from increased average fares, $12 million in higher commissions in 2010 related to our increased
participation in GDSs and OTAs and $2 million in higher advertising costs. Cost per available seat mile
increased 12% due to increased fares and shift in distribution channels as a result of our increased capabilities
from our new customer service system.
Maintenance materials and repairs increased 15%, or $23 million, due to five additional average operating
aircraft in 2010 compared to 2009 and the gradual aging of our fleet. The average age of our fleet increased to 5.4
years as of December 31, 2010 compared to 4.3 years as of December 31, 2009. Maintenance expense is
expected to increase significantly as our fleet ages, resulting in the need for more exhaustive routine maintenance
checks. Cost per available seat mile increased 8% primarily due to the gradual aging of our fleet.
Other operating expenses increased 23%, or $96 million, due to an increase in variable costs associated with
5% more departures versus 2009, operating out of three additional cities in 2010 in addition to the full year of
operations at the eight cities opened throughout 2009, and a severe winter storm season in early 2010. We also
incurred approximately $13 million in one-time implementation expenses related to our new customer service
system, as well as overall higher technology infrastructure related costs. Additionally, we incurred a $6 million
one-time impairment expense related to the intangible assets and other costs associated with developing an air to
ground connectivity capability by LiveTV. In 2010, we also paid a $5 million rescheduling fee in connection
with the deferral of aircraft. In 2009, other operating expenses were offset by $11 million for certain tax
incentives and $1 million in gains on sales of aircraft. Cost per available seat mile increased 15% due primarily
to the implementation costs associated with our new customer service system, changes in our IT infrastructure
and the 2009 tax incentive credits.
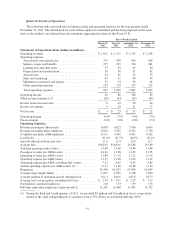
Other Income (Expense). Interest expense decreased 9%, or $18 million, primarily due to lower debt
balances and changes in interest rates, totaling approximately $14 million, and retirements of debt which resulted
in approximately $14 million less interest expense. These decreases in interest expense were offset by additional
financing including four new aircraft and the issuance in June 2009 of our 6.75% convertible debentures,
resulting in $11 million of additional interest expense. Capitalized interest decreased due to lower average
outstanding pre-delivery deposits and lower interest rates.
Interest income and other decreased 62%, or $6 million, primarily due to lower interest rates earned on
investments. Interest income and other included $2 million in gains on the extinguishment of debt in 2009.
Derivative instruments not qualifying as cash flow hedges in 2010 resulted in an insignificant loss, compared to
losses of $1 million in 2009. Accounting ineffectiveness on crude, heating oil and jet fuel derivatives classified
as cash flow hedges resulted in losses of $2 million in 2010 and gains of $1 million in 2009. We are unable to
predict what the amount of ineffectiveness will be related to these instruments, or the potential loss of hedge
accounting which is determined on a derivative-by-derivative basis, due to the volatility in the forward markets
for these commodities.
Our effective tax rate was 40% in 2010 compared to 41% in 2009. Our effective tax rate differs from the
statutory income tax rate due to the non-deductibility of certain items for tax purposes and the relative size of
these items to our pre-tax income of $161 million in 2010 and pre-tax income of $104 million in 2009.
40