JetBlue Airlines 2011 Annual Report Download - page 80
Download and view the complete annual report
Please find page 80 of the 2011 JetBlue Airlines annual report below. You can navigate through the pages in the report by either clicking on the pages listed below, or by using the keyword search tool below to find specific information within the annual report.-
 1
1 -
2
-
3
-
4
-
5
-
6
-
7
-
8
-
9
-
10
-
11
-
12
-
13
-
14
-
15
-
16
-
17
-
18
-
19
-
20
-
21
-
22
-
23
-
24
-
25
-
26
-
27
-
28
-
29
-
30
-
31
-
32
-
33
-
34
-
35
-
36
-
37
-
38
-
39
-
40
-
41
-
42
-
43
-
44
-
45
-
46
-
47
-
48
-
49
-
50
-
51
-
52
-
53
-
54
-
55
-
56
-
57
-
58
-
59
-
60
-
61
-
62
-
63
-
64
-
65
-
66
-
67
-
68
-
69
-
 70
70 -
 71
71 -
 72
72 -
 73
73 -
 74
74 -
 75
75 -
 76
76 -
 77
77 -
 78
78 -
 79
79 -
 80
80 -
 81
81 -
 82
82 -
 83
83 -
 84
84 -
 85
85 -
 86
86 -
 87
87 -
 88
88 -
 89
89 -
 90
90 -
91
-
92
-
93
-
94
-
95
-
96
-
97
-
98
-
99
-
100
-
101
-
102
-
103
-
104
-
105
-
106
-
107
-
108
-
109
-
110
-
111
-
112
-
113
-
114
-
115
-
116
-
117
-
118
-
119
-
120
-
121
-
122
-
123
-
124
-
125
-
126
-
127
-
128
-
129
-
130
-
131
 |
 |

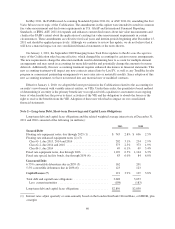
The following is a summary of restricted stock unit activity under the 2002 Plan for the year ended
December 31:
2011 2010 2009
Shares
Weighted
Average
Grant Date
Fair Value Shares
Weighted
Average
Grant Date
Fair Value Shares
Weighted
Average
Grant Date
Fair Value
Nonvested at beginning of year ..... 3,681,013 $5.18 3,310,374 $5.13 1,735,671 $6.22
Granted ........................ 2,677,809 6.01 2,086,973 5.36 2,294,240 4.61
Vested ........................ (1,731,145) 5.26 (1,262,459) 5.32 (595,105) 6.28
Forfeited ....................... (534,193) 5.53 (453,875) 5.21 (124,432) 5.36
Nonvested at end of year .......... 4,093,484 $5.64 3,681,013 $5.18 3,310,374 $5.13
The total intrinsic value, determined as of the date of vesting, of restricted stock units vested and converted
to shares of common stock during the twelve months ended December 31, 2011 and 2010 was $10 million and $7
million, respectively.
We began issuing deferred stock units in 2008 under the 2002 Plan to members of our Board of
Directors. Prior to 2011, these awards vested immediately upon being granted. Beginning in 2011, the vesting
period was changed to either one or three years of service. Once vested, shares are issued six months and one day
following the Director’s departure from the Board. During the year ended December 31, 2011, we granted an
insignificant amount of deferred stock units, all of which remain outstanding at December 31, 2011.
Prior to January 1, 2006, stock options under the 2002 Plan became exercisable when vested, which
occurred in annual installments of three to seven years. For issuances under the 2002 Plan beginning in 2006, we
revised the vesting terms so that all options granted vest in equal installments over a period of three or five years,
or upon the occurrence of a change in control. All options issued under the 2002 Plan expire ten years from the
date of grant. Our policy is to grant options with an exercise price equal to the market price of the underlying
common stock on the date of grant.
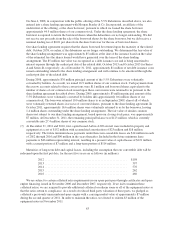
The following is a summary of stock option activity for the years ended December 31:
2011 2010 2009
Shares
Weighted
Average
Exercise
Price Shares
Weighted
Average
Exercise
Price Shares
Weighted
Average
Exercise
Price
Outstanding at beginning of year ...... 23,600,494 $13.42 25,592,883 $12.88 27,242,115 $12.47
Granted .......................... — — — — — —
Exercised ........................ (934,993) 2.09 (1,158,187) 1.61 (960,626) 0.78
Forfeited ......................... (23,700) 8.92 (27,605) 11.32 (93,062) 11.00
Expired .......................... (834,631) 13.33 (806,597) 13.40 (595,544) 13.99
Outstanding at end of year ........... 21,807,170 13.91 23,600,494 13.42 25,592,883 12.88
Vested at end of year ............... 21,550,526 13.94 22,504,450 13.47 23,101,559 12.86
Available for future grants ........... 50,494,384 39,997,981 29,189,222
70