JetBlue Airlines 2011 Annual Report Download - page 47
Download and view the complete annual report
Please find page 47 of the 2011 JetBlue Airlines annual report below. You can navigate through the pages in the report by either clicking on the pages listed below, or by using the keyword search tool below to find specific information within the annual report.-
 1
1 -
2
-
3
-
4
-
5
-
6
-
7
-
8
-
9
-
10
-
11
-
12
-
13
-
14
-
15
-
16
-
17
-
18
-
19
-
20
-
21
-
22
-
23
-
24
-
25
-
26
-
27
-
28
-
29
-
30
-
31
-
32
-
33
-
34
-
35
-
36
-
 37
37 -
 38
38 -
 39
39 -
 40
40 -
 41
41 -
 42
42 -
 43
43 -
 44
44 -
 45
45 -
 46
46 -
 47
47 -
 48
48 -
 49
49 -
 50
50 -
 51
51 -
 52
52 -
 53
53 -
 54
54 -
 55
55 -
 56
56 -
 57
57 -
58
-
59
-
60
-
61
-
62
-
63
-
64
-
65
-
66
-
67
-
68
-
69
-
70
-
71
-
72
-
73
-
74
-
75
-
76
-
77
-
78
-
79
-
80
-
81
-
82
-
83
-
84
-
85
-
86
-
87
-
88
-
89
-
90
-
91
-
92
-
93
-
94
-
95
-
96
-
97
-
98
-
99
-
100
-
101
-
102
-
103
-
104
-
105
-
106
-
107
-
108
-
109
-
110
-
111
-
112
-
113
-
114
-
115
-
116
-
117
-
118
-
119
-
120
-
121
-
122
-
123
-
124
-
125
-
126
-
127
-
128
-
129
-
130
-
131
 |
 |
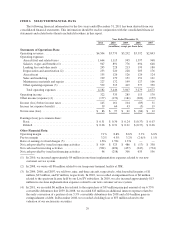
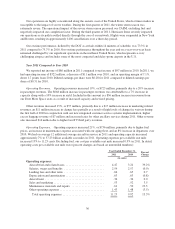
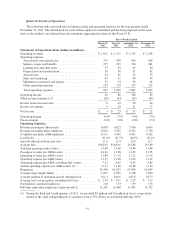
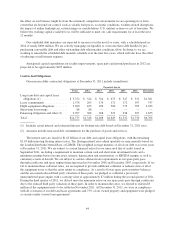
Aircraft fuel expense increased 49%, or $549 million, due to a 38% increase in average fuel cost per gallon,
or $461 million after the impact of fuel hedging and 39 million more gallons of aircraft fuel consumed, resulting
in $88 million of higher fuel expense. We recorded $3 million in effective fuel hedge gains, which were an offset
to fuel expense, during 2011 versus $3 million in effective fuel hedge losses, which were an addition to fuel
expense, during 2010. Our average fuel cost per gallon was $3.17 for the year ended December 31, 2011
compared to $2.29 for the year ended December 31, 2010. Our fuel costs represented 40% and 32% of our
operating expenses in 2011 and 2010, respectively. Based on our expected fuel volume for 2012, a 10% per
gallon increase in the cost of aircraft fuel would increase our annual fuel expense by approximately $175 million.
Cost per available seat mile increased 39% primarily due to the increase in fuel prices.
Salaries, wages and benefits increased 6%, or $56 million, primarily due to a 5% increase in the average
number of full-time equivalent employees needed to support our profitable growth plans as well as certain
increases in wages and related benefits as a result of pay increases and the increasing seniority levels of our
crewmembers. Cost per available seat mile decreased 1% primarily due to the increased capacity and improved
employee efficiencies.
Landing fees and other rents increased 8%, or $17 million, primarily due to an 8% increase in departures
over 2010, which includes the effects of expanded operations in certain markets and the opening of seven new
cities in 2011 as well as an increase in average landing fee and airport rental rates.
Depreciation and amortization increased 6%, or $13 million. The increase in depreciation expense was
primarily a result of having an average of 105 owned and capital leased aircraft in 2011 compared to 97 in 2010.
The increased depreciation was slightly offset by a reduction in owned computer hardware.
Aircraft rent increased 7%, or $9 million, due to our leasing of six used aircraft during the second half of
2010, slightly offset by extending the leases on four aircraft during 2011 at lower rates.
Sales and marketing expense increased 11%, or $20 million, due to $14 million in higher credit card fees
resulting from increased average fares, $3 million in higher commissions in 2011 related to our increased
participation in GDSs and OTAs and $2 million in higher advertising costs. Cost per available seat mile
increased 3% due to costs associated with increased fares.
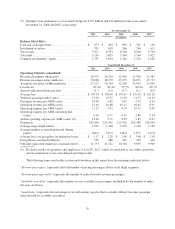
Maintenance materials and repairs increased 32%, or $55 million, due to 12 additional average operating
aircraft in 2011 compared to 2010, the gradual aging of our fleet, and aircraft coming off of warranty. As of
December 31, 2011, our oldest operating aircraft had an age of 12.1 years and the average age of our fleet
increased to 6.1 years compared to 5.4 years as of December 31, 2010. Maintenance expense is expected to
increase significantly as our fleet ages, resulting in the need for additional, more expensive repairs over time.
Cost per available seat mile increased 23% primarily due to the gradual aging of our fleet.
Other operating expenses increased 3%, or $17 million, due to an increase in variable costs associated with
8% more departures versus 2010, operating out of seven additional cities in 2011 in addition to the full year of
operations at the three cities opened throughout 2010. In 2010, we incurred approximately $13 million in
one-time implementation expenses related to our new customer service system and a $6 million one-time
impairment expense related to the intangible assets and other costs associated with developing an air to ground
connectivity capability. In 2010, we also paid a $5 million rescheduling fee in connection with the deferral of
aircraft. Cost per available seat mile decreased 4% due primarily to the 2010 implementation costs associated
with our new customer service system and the one-time impairment expense in 2010.
Other Income (Expense). Interest expense remained relatively unchanged from 2010. Decreases due to the
extinguishments of higher yielding debt resulted in approximately $2 million less interest expense. These
decreases in interest expense were offset by additional financing including 13 new aircraft during 2010 and 2011,
resulting in $9 million of additional interest expense. Capitalized interest increased due to higher average
outstanding pre-delivery deposits on near term delivery aircraft.
37