JetBlue Airlines 2011 Annual Report Download - page 45
Download and view the complete annual report
Please find page 45 of the 2011 JetBlue Airlines annual report below. You can navigate through the pages in the report by either clicking on the pages listed below, or by using the keyword search tool below to find specific information within the annual report.-
 1
1 -
2
-
3
-
4
-
5
-
6
-
7
-
8
-
9
-
10
-
11
-
12
-
13
-
14
-
15
-
16
-
17
-
18
-
19
-
20
-
21
-
22
-
23
-
24
-
25
-
26
-
27
-
28
-
29
-
30
-
31
-
32
-
33
-
34
-
 35
35 -
 36
36 -
 37
37 -
 38
38 -
 39
39 -
 40
40 -
 41
41 -
 42
42 -
 43
43 -
 44
44 -
 45
45 -
 46
46 -
 47
47 -
 48
48 -
 49
49 -
 50
50 -
 51
51 -
 52
52 -
 53
53 -
 54
54 -
 55
55 -
56
-
57
-
58
-
59
-
60
-
61
-
62
-
63
-
64
-
65
-
66
-
67
-
68
-
69
-
70
-
71
-
72
-
73
-
74
-
75
-
76
-
77
-
78
-
79
-
80
-
81
-
82
-
83
-
84
-
85
-
86
-
87
-
88
-
89
-
90
-
91
-
92
-
93
-
94
-
95
-
96
-
97
-
98
-
99
-
100
-
101
-
102
-
103
-
104
-
105
-
106
-
107
-
108
-
109
-
110
-
111
-
112
-
113
-
114
-
115
-
116
-
117
-
118
-
119
-
120
-
121
-
122
-
123
-
124
-
125
-
126
-
127
-
128
-
129
-
130
-
131
 |
 |
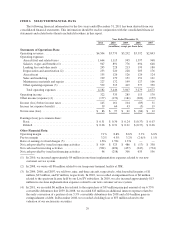
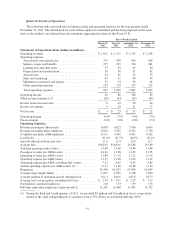
operational efficiencies. Other operating expenses consist of purchased services (including expenses related to
fueling, ground handling, skycap, security and janitorial services), insurance, personnel expenses, cost of goods
sold to other airlines by LiveTV, professional fees, passenger refreshments, supplies, bad debts, communication
costs, and taxes other than payroll and fuel taxes.
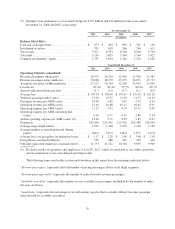
During 2011 fuel prices remained volatile, increasing 38% over average 2010 prices. We actively manage
our fuel hedge portfolio by entering into a variety of fuel hedge contracts in order to provide some protection
against sharp and sudden volatility and further increases in fuel prices. In total, we hedged 43% of our total 2011
fuel consumption. As of December 31, 2011, we had outstanding fuel hedge contracts covering approximately
42% of our forecasted consumption for the first quarter of 2012 and 27% for the full year 2012. We will continue
to monitor fuel prices closely and intend to take advantage of fuel hedging opportunities as they become
available.
The airline industry is one of the most heavily taxed in the U.S., with taxes and fees accounting for
approximately 15% of the total fare charged to a customer. Airlines are obligated to fund all of these taxes and
fees regardless of their ability to pass these charges on to the customer. Additionally, if the TSA were to change
the way the Aviation Security Infrastructure Fee is assessed, our security costs could be higher.
We continue to focus on maintaining an adequate liquidity level. Our goal is to continue to be diligent with
our liquidity, thereby managing our capital expenditures to accommodate a sustainable growth plan. We have
manageable scheduled debt maturities in 2012 totaling approximately $200 million, which we believe will enable
us to achieve our liquidity goals. During 2011, we pre-purchased $39 million of our 6.75% Series A convertible
debentures due 2039, as we believe this will help better manage future debt maturities and reduce overall interest
expense.
Outlook for 2012
In 2012, our focus will continue to be on our culture, offerings, and foundations, which we have outlined as
key elements of our value proposition. We anticipate building upon our strong financial foundation during 2012
by controlling costs, to the extent possible, in order to maintain a competitive cost advantage and maximizing
unit revenues through our unique product offering and focused network strategy. We aim to deliver improved
year over year margins. We continuously look to expand our other ancillary revenue opportunities and enhance
the JetBlue Experience for all of our customers, leisure and business travelers alike. We are also focused on
managing our future debt maturities and investing in infrastructure and product enhancements that will result in
future benefits.
For the full year, we expect our operating capacity to increase approximately 5.5% to 7.5% over 2011 with
the net addition of seven Airbus A320 aircraft and four EMBRAER 190 aircraft to our operating fleet. Assuming
fuel prices of $3.17 per gallon, including fuel taxes and net of our fuel hedging activity, our cost per available
seat mile for 2012 is expected to increase by 1.5% to 3.5% over 2011. This expected increase is a result of higher
maintenance costs due to the aging of our fleet and assumed increase in fuel prices. While we expect to face
significant cost pressures on maintenance expense in 2012 related to the aging of our fleet, we are working
diligently to reduce these cost pressures in the future.
Results of Operations
During 2011, overall economic conditions remained volatile and the competitive nature of the airline
industry persisted. We generated consistent unit revenue growth throughout the year by managing our network
and balancing the seasonality created by our highly leisure focused business. We did so by complementing our
leisure travel markets with higher yielding business markets and capitalizing on key growth regions, primarily
Boston and the Caribbean, which has resulted in increased capacity. Average fares for the year increased 10%
over 2010 to $155 and yield increased 10% on a capacity increase of 7%.
35