JetBlue Airlines 2011 Annual Report Download - page 91
Download and view the complete annual report
Please find page 91 of the 2011 JetBlue Airlines annual report below. You can navigate through the pages in the report by either clicking on the pages listed below, or by using the keyword search tool below to find specific information within the annual report.-
 1
1 -
2
-
3
-
4
-
5
-
6
-
7
-
8
-
9
-
10
-
11
-
12
-
13
-
14
-
15
-
16
-
17
-
18
-
19
-
20
-
21
-
22
-
23
-
24
-
25
-
26
-
27
-
28
-
29
-
30
-
31
-
32
-
33
-
34
-
35
-
36
-
37
-
38
-
39
-
40
-
41
-
42
-
43
-
44
-
45
-
46
-
47
-
48
-
49
-
50
-
51
-
52
-
53
-
54
-
55
-
56
-
57
-
58
-
59
-
60
-
61
-
62
-
63
-
64
-
65
-
66
-
67
-
68
-
69
-
70
-
71
-
72
-
73
-
74
-
75
-
76
-
77
-
78
-
79
-
80
-
 81
81 -
 82
82 -
 83
83 -
 84
84 -
 85
85 -
 86
86 -
 87
87 -
 88
88 -
 89
89 -
 90
90 -
 91
91 -
 92
92 -
 93
93 -
 94
94 -
 95
95 -
 96
96 -
 97
97 -
 98
98 -
 99
99 -
 100
100 -
 101
101 -
102
-
103
-
104
-
105
-
106
-
107
-
108
-
109
-
110
-
111
-
112
-
113
-
114
-
115
-
116
-
117
-
118
-
119
-
120
-
121
-
122
-
123
-
124
-
125
-
126
-
127
-
128
-
129
-
130
-
131
 |
 |

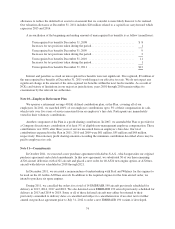
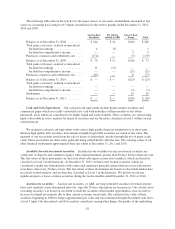
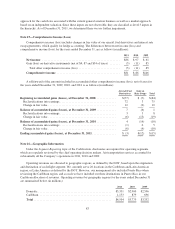
The following table reflects the activity for the major classes of our assets and liabilities measured at fair
value on a recurring basis using level 3 inputs (in millions) for the twelve months ended December 31, 2011,
2010 and 2009:
Auction Rate
Securities
Put Option
related to ARS
Interest Rate
Swaps Total
Balance as of December 31, 2008 ........... $244 $14 $(10) $ 248
Total gains or (losses), realized or unrealized
Included in earnings .................... 4 (3) — 1
Included in comprehensive income ........ — — 5 5
Purchases, issuances and settlements, net ..... (174) — (5) (179)
Balance as of December 31, 2009 ........... $ 74 $11 $(10) $ 75
Total gains or (losses), realized or unrealized
Included in earnings .................... 11 (11) — —
Included in comprehensive income ........ — — (21) (21)
Purchases, issuances and settlements, net ..... (85) — 8 (77)
Balance as of December 31, 2010 ........... $ — $— $(23) $ (23)
Total gains or (losses), realized or unrealized
Included in earnings .................... — — — —
Included in comprehensive income ........ — — (7) (7)
Settlements ............................. — — 10 10
Balance as of December 31, 2011 ........... $ — $— $(20) $ (20)
Cash and Cash Equivalents: Our cash and cash equivalents include money market securities and
commercial paper which are readily convertible into cash with maturities of three months or less when
purchased, all of which are considered to be highly liquid and easily tradable. These securities are valued using
inputs observable in active markets for identical securities and are therefore classified as level 1 within our fair
value hierarchy.
We maintain cash and cash equivalents with various high quality financial institutions or in short-term
duration high quality debt securities. Investments in highly liquid debt securities are stated at fair value. The
majority of our receivables result from the sale of tickets to individuals, mostly through the use of major credit
cards. These receivables are short-term, generally being settled shortly after the sale. The carrying values of all
other financial instruments approximated their fair values at December 31, 2011 and 2010.
Available-for-sale investment securities: Included in our available-for-sale investment securities are
certificates of deposits and commercial paper with original maturities greater than 90 days but less than one year.
The fair values of these instruments are based on observable inputs in non-active markets, which are therefore
classified as Level 2 in the hierarchy. At December 31, 2010, we held asset backed securities, which are
considered variable rate demand notes with contractual maturities generally greater than ten years with interest
reset dates often every 30 days or less. The fair values of these investments are based on observable market data
in actively traded markets, and are therefore classified as Level 1 in the hierarchy. We did not record any
significant gains or losses on these securities during the twelve months ended December 31, 2011 or 2010.
Auction rate securities: Auction rate securities, or ARS, are long-term debt securities for which interest
rates reset regularly at pre-determined intervals, typically 28 days, through an auction process. Our classification
as trading securities was based on our intent to trade the securities when market opportunities arose in order to
increase our liquid investments due to then current economic uncertainty. The estimated fair value of these
securities beginning in 2008 no longer approximated par value and was estimated through discounted cash flows,
a level 3 input. Our discounted cash flow analysis considered, among other things, the quality of the underlying
81