JetBlue Airlines 2011 Annual Report Download - page 38
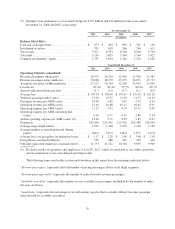
Download and view the complete annual report
Please find page 38 of the 2011 JetBlue Airlines annual report below. You can navigate through the pages in the report by either clicking on the pages listed below, or by using the keyword search tool below to find specific information within the annual report.-
 1
1 -
2
-
3
-
4
-
5
-
6
-
7
-
8
-
9
-
10
-
11
-
12
-
13
-
14
-
15
-
16
-
17
-
18
-
19
-
20
-
21
-
22
-
23
-
24
-
25
-
26
-
27
-
 28
28 -
 29
29 -
 30
30 -
 31
31 -
 32
32 -
 33
33 -
 34
34 -
 35
35 -
 36
36 -
 37
37 -
 38
38 -
 39
39 -
 40
40 -
 41
41 -
 42
42 -
 43
43 -
 44
44 -
 45
45 -
 46
46 -
 47
47 -
 48
48 -
49
-
50
-
51
-
52
-
53
-
54
-
55
-
56
-
57
-
58
-
59
-
60
-
61
-
62
-
63
-
64
-
65
-
66
-
67
-
68
-
69
-
70
-
71
-
72
-
73
-
74
-
75
-
76
-
77
-
78
-
79
-
80
-
81
-
82
-
83
-
84
-
85
-
86
-
87
-
88
-
89
-
90
-
91
-
92
-
93
-
94
-
95
-
96
-
97
-
98
-
99
-
100
-
101
-
102
-
103
-
104
-
105
-
106
-
107
-
108
-
109
-
110
-
111
-
112
-
113
-
114
-
115
-
116
-
117
-
118
-
119
-
120
-
121
-
122
-
123
-
124
-
125
-
126
-
127
-
128
-
129
-
130
-
131
 |
 |
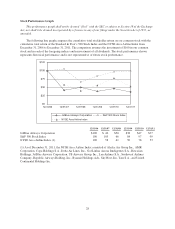
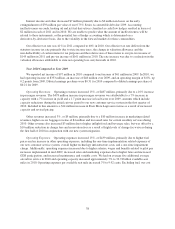
Stock Performance Graph
This performance graph shall not be deemed “filed” with the SEC or subject to Section 18 of the Exchange
Act, nor shall it be deemed incorporated by reference in any of our filings under the Securities Act of 1933, as
amended.
The following line graph compares the cumulative total stockholder return on our common stock with the
cumulative total return of the Standard & Poor’s 500 Stock Index and the NYSE Arca Airline Index from
December 31, 2006 to December 31, 2011. The comparison assumes the investment of $100 in our common
stock and in each of the foregoing indices and reinvestment of all dividends. The stock performance shown
represents historical performance and is not representative of future stock performance.
$0
$25
$50
$75
$100
$125
12/31/1112/31/1012/31/0912/31/0812/31/0712/31/06
JetBlue Airways Corporation S&P 500 Stock Index
NYSE Arca Airline Index
12/31/06 12/31/07 12/31/08 12/31/09 12/31/10 12/31/11
JetBlue Airways Corporation $100 $ 42 $50 $38 $47 $37
S&P 500 Stock Index 100 105 66 84 97 99
NYSE Arca Airline Index (1) 100 58 41 56 78 53
(1) As of December 31, 2011, the NYSE Arca Airline Index consisted of Alaska Air Group Inc., AMR
Corporation, Copa Holdings S.A., Delta Air Lines, Inc., Gol Linhas Aereas Inteligentes S.A., Hawaiian
Holdings, JetBlue Airways Corporation, US Airways Group, Inc., Lan Airlines S.A., Southwest Airlines
Company, Republic Airways Holding, Inc., Ryanair Holdings Ads., SkyWest, Inc, Tam S.A., and United
Continental Holdings Inc.
28