IBM 2000 Annual Report Download - page 95
Download and view the complete annual report
Please find page 95 of the 2000 IBM annual report below. You can navigate through the pages in the report by either clicking on the pages listed below, or by using the keyword search tool below to find specific information within the annual report.-
 1
1 -
2
-
3
-
4
-
5
-
6
-
7
-
8
-
9
-
10
-
11
-
12
-
13
-
14
-
15
-
16
-
17
-
18
-
19
-
20
-
21
-
22
-
23
-
24
-
25
-
26
-
27
-
28
-
29
-
30
-
31
-
32
-
33
-
34
-
35
-
36
-
37
-
38
-
39
-
40
-
41
-
42
-
43
-
44
-
45
-
46
-
47
-
48
-
49
-
50
-
51
-
52
-
53
-
54
-
55
-
56
-
57
-
58
-
59
-
60
-
61
-
62
-
63
-
64
-
65
-
66
-
67
-
68
-
69
-
70
-
71
-
72
-
73
-
74
-
75
-
76
-
77
-
78
-
79
-
80
-
81
-
82
-
83
-
84
-
 85
85 -
 86
86 -
 87
87 -
 88
88 -
 89
89 -
 90
90 -
 91
91 -
 92
92 -
 93
93 -
 94
94 -
 95
95 -
 96
96 -
 97
97 -
 98
98 -
 99
99 -
 100
100
 |
 |

page no.
ninety-three
notes to consolidated financial statements
international business machines corporation
and Subsidiary Companies
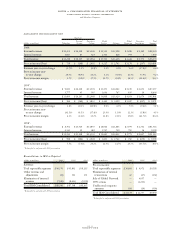
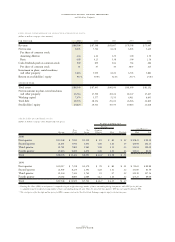
Reconciliations to IBM as Reported
(dollars in millions) 2000 1999*1998*
Assets:
Total reportable segments $«69,263 $«66,560 $«67,752
Elimination of internal
transactions (5,300) (5,776) (7,519)
Unallocated amounts:
Cash and marketable
securities 2,268 4,563 4,295
Notes and accounts
receivable 3,145 2,658 3,085
Deferred tax assets 5,498 5,428 5,376
Plant, other property
and equipment 3,798 4,161 5,720
Pension assets 6,809 5,636 4,836
Other 2,868 4,265 2,555
Total IBM Consolidated $«88,349 $«87,495 $«86,100
*Reclassified to conform with 2000 presentation.
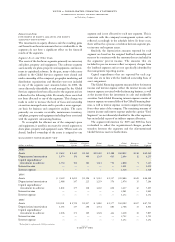
Revenue by Classes of Similar Products or Services
For the Personal Systems, Software and Global Financing
segments, the segment data on page 91 represents the
revenue contributions from the products that are contained
in the segments and that are basically similar in nature. The
following table provides external revenue for similar classes
of products within the Technology, Enterprise Systems and
Global Services segments. The Technology segment’s OEM
hardware comprises revenue primarily from the sale of HDD
storage files, semiconductors and display devices. Other
technology comprises advanced function printers and net-
working components. The Enterprise Systems segment’s
storage comprises revenue from the Enterprise Storage Server
(“Shark”), other disk storage products and tape subsystems.
Consolidated
(dollars in millions) 2000 1999*1998*
Technology:
OEM $«««8,305 $«««7,794 $«««6,742
Other technology 1,916 2,038 1,959
Enterprise Systems:
Servers $«««8,692 $«««8,718 $«10,624
Storage 2,490 2,356 2,439
Networking products 158 429 784
Global Services:
Services $«28,036 $«27,035 $«23,730
Maintenance 5,116 5,137 5,186
*Reclassified to conform with 2000 presentation.
Major Customers
No single customer represents 10 percent or more of the
company’s total revenue.
Geographic Information
Revenue*Long-lived Assets**
(dollars in millions) 2000 1999 1998 2000 1999 1998
United States $«37,216 $«37,171 $«35,303 $«21,449 $«19,309 $«18,450
Japan 12,128 10,411 8,567 4,319 4,710 4,310
Other countries 39,052 39,966 37,797 10,029 10,259 12,343
Total $«88,396 $«87,548 $«81,667 $«35,797 $«34,278 $«35,103
*Revenues are attributed to countries based on location of customer.
** Includes all non-current assets except non-current financial instruments and deferred tax assets.