IBM 2000 Annual Report Download - page 62
Download and view the complete annual report
Please find page 62 of the 2000 IBM annual report below. You can navigate through the pages in the report by either clicking on the pages listed below, or by using the keyword search tool below to find specific information within the annual report.-
 1
1 -
2
-
3
-
4
-
5
-
6
-
7
-
8
-
9
-
10
-
11
-
12
-
13
-
14
-
15
-
16
-
17
-
18
-
19
-
20
-
21
-
22
-
23
-
24
-
25
-
26
-
27
-
28
-
29
-
30
-
31
-
32
-
33
-
34
-
35
-
36
-
37
-
38
-
39
-
40
-
41
-
42
-
43
-
44
-
45
-
46
-
47
-
48
-
49
-
50
-
51
-
 52
52 -
 53
53 -
 54
54 -
 55
55 -
 56
56 -
 57
57 -
 58
58 -
 59
59 -
 60
60 -
 61
61 -
 62
62 -
 63
63 -
 64
64 -
 65
65 -
 66
66 -
 67
67 -
 68
68 -
 69
69 -
 70
70 -
 71
71 -
 72
72 -
73
-
74
-
75
-
76
-
77
-
78
-
79
-
80
-
81
-
82
-
83
-
84
-
85
-
86
-
87
-
88
-
89
-
90
-
91
-
92
-
93
-
94
-
95
-
96
-
97
-
98
-
99
-
100
 |
 |
Investments
The company’s investments for plant, rental machines and
other property were $5,616 million for 2000, a decrease of
$343 million from 1999.
In addition to software development expenses included in
research, development and engineering, the company capital-
ized $565 million of software costs during 2000, an increase
of $101 million from the 1999 period. The increase resulted,
in part, from the adoption of Emerging Issues Task Force
Issue No. 00-2, “Accounting for Web Site Development
Costs.” In 2000 the company capitalized $81 million of certain
Web site development costs.
Investments and sundry assets were $14,447 million at the
end of 2000, an increase of $775 million from 1999, primarily
the result of increases in prepaid pension assets and deferred
taxes, offset by declines in alliance investments and goodwill.
See note H, “Investments and Sundry Assets,” on page 74
for additional information.
The company continues to invest significantly in its rap-
idly growing services business, primarily in the management
of customers’ information technology and in manufacturing
capacity for microelectronics. The company has announced
plans to redirect approximately $1 billion in 2001 to the
open-source Linux operating system including hardware
and software development, the operation of its Linux
Technology Center, and various marketing initiatives across
the country. Additionally, the company plans to invest $4 bil-
lion over the next three years in the information technology
outsourcing sector.
On October 10, 2000, the company announced plans to
invest $5.0 billion in the following projects: (1) building an
advanced chip-making facility in East Fishkill, New York; (2)
expanding its chip-making capacity in Burlington, Vermont
and Yasu, Japan, as well as at a joint venture in Essonnes,
France; and (3) expanding its organic and ceramic chip pack-
aging operations worldwide. The company anticipates these
actions to be completed over the next four years.
The company has remaining authorization as of
December 31, 2000, to purchase $2,870 million of IBM
common shares in the open market from time to time, based
on market conditions.
The company expects to fund these investments prima-
rily with cash from ongoing operations.
Debt and Equity
The majority of the company’s funding is executed by
Corporate Treasury in support of the Global Financing
segment. A process has been established for monitoring the
Global Financing funding requirements and executing
strategies to manage the company’s overall asset and liability
profile. Additionally, the company maintains sufficient
flexibility to access global funding sources as needed.
During 2000, the company issued debt denominated in U.S.
dollars, Japanese yen, Euros and Swiss francs to meet exist-
ing financing needs.
The company’s total debt increased $222 million to
$28,576 million. Financing businesses have different capital
structures than non-financing businesses, and therefore the
analysis of this change and certain ratios are discussed below
on both a Global Financing and a non-global financing basis.
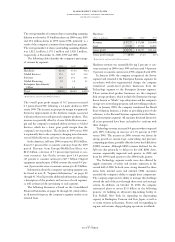
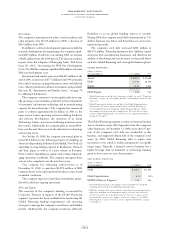
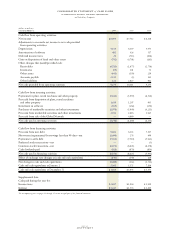
GLOBAL FINANCING
(dollars in millions)
AT DECEMBER 31: 2000 1999
Assets*$«40,822 $«39,686
Debt** 27,514 26,799
Equity ÷«4,142 «««4,864
Debt/Equity 6.6x5.5x
*Global Financing assets include cash, financing receivables (see note F, “Financing
Receivables,” on page 74), intercompany amounts, rental machine fixed assets and
other assets.
** Global Financing debt includes external debt of the Global Financing business
that generates the interest expense included in Cost of Global Financing on
the Consolidated Statement of Earnings. Global Financing debt also includes
intercompany borrowings from other company units. The total interest expense
related to Global Financing debt is presented in note X, “Segment Information,”
on pages 89 through 93.
The Global Financing segment is a financial services business
and is, therefore, more debt dependent than the company’s
other businesses. At December 31, 2000, more than 95 per-
cent of the company’s total debt was attributable to this
business, and supported almost half of the company’s total
assets. In 2000, Global Financing debt to equity ratio
increased to 6.6x, which is within management’s acceptable
target range. Typically, a financial services business has a
higher leverage than an industrial or technology business
given its low return on asset characteristics.
non-global financing
(dollars in millions)
AT DECEMBER 31: 2000 1999
Debt*$«1,062 $«1,555
Debt/Capitalization 6.1% 9.0%
EBITDA/Interest Expense** ÷«24x«««19x
*Non-global financing debt is the company’s total external debt less the Global
Financing debt described in the Global Financing table above.
** EBITDA is earnings before interest and taxes, plus depreciation and amortization,
adjusted for minimum rental commitments and for one-time items such as the
1999 actions and the sale of the Global Network. The interest expense used in
the denominator represents the company’s total interest expense less the Global
Financing interest expense disclosed in note X, “Segment Information,” on pages
89 through 93.
management discussion
international business machines corporation
and Subsidiary Companies
page no.
sixty