IBM 2000 Annual Report Download - page 82
Download and view the complete annual report
Please find page 82 of the 2000 IBM annual report below. You can navigate through the pages in the report by either clicking on the pages listed below, or by using the keyword search tool below to find specific information within the annual report.-
 1
1 -
2
-
3
-
4
-
5
-
6
-
7
-
8
-
9
-
10
-
11
-
12
-
13
-
14
-
15
-
16
-
17
-
18
-
19
-
20
-
21
-
22
-
23
-
24
-
25
-
26
-
27
-
28
-
29
-
30
-
31
-
32
-
33
-
34
-
35
-
36
-
37
-
38
-
39
-
40
-
41
-
42
-
43
-
44
-
45
-
46
-
47
-
48
-
49
-
50
-
51
-
52
-
53
-
54
-
55
-
56
-
57
-
58
-
59
-
60
-
61
-
62
-
63
-
64
-
65
-
66
-
67
-
68
-
69
-
70
-
71
-
 72
72 -
 73
73 -
 74
74 -
 75
75 -
 76
76 -
 77
77 -
 78
78 -
 79
79 -
 80
80 -
 81
81 -
 82
82 -
 83
83 -
 84
84 -
 85
85 -
 86
86 -
 87
87 -
 88
88 -
 89
89 -
 90
90 -
 91
91 -
 92
92 -
93
-
94
-
95
-
96
-
97
-
98
-
99
-
100
 |
 |
page no.
eighty
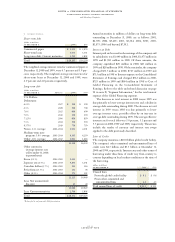
notes to consolidated financial statements
international business machines corporation
and Subsidiary Companies
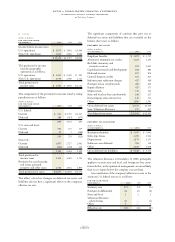
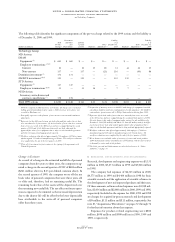
OTAXES
(dollars in millions)
FOR THE YEAR ENDED
DECEMBER 31: 2000 1999 1998
Income before income taxes:
U.S. operations $«««5,871 $«««5,892 $«2,960
Non-U.S. operations 5,663 5,865 6,080
$«11,534 $«11,757 $«9,040
The provision for income
taxes by geographic
operations is as follows:
U.S. operations «$«««1,692 $«««2,005 $««««991
Non-U.S. operations 1,749 2,040 1,721
Total provision for
income taxes $«««3,441 $«««4,045 $«2,712
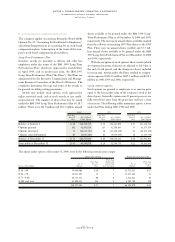
The components of the provision for income taxes by taxing
jurisdiction are as follows:
(dollars in millions)
FOR THE YEAR ENDED
DECEMBER 31: 2000 1999 1998
U.S. federal:
Current $««««613 $«1,759 $«1,117
Deferred 286 (427) (475)
899 1,332 642
U.S. state and local:
Current 192 272 139
Deferred 47 7 (260)
239 279 (121)
Non-U.S.:
Current 2,607 2,727 2,062
Deferred (304) (293) 129
2,303 2,434 2,191
Total provision for
income taxes 3,441 4,045 2,712
Provision for social security,
real estate, personal
property and other taxes 2,766 2,831 2,859
Total provision for taxes $«6,207 $«6,876 $«5,571
The effect of tax law changes on deferred tax assets and
liabilities did not have a significant effect on the company’s
effective tax rate.
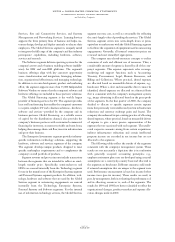
The significant components of activities that gave rise to
deferred tax assets and liabilities that are recorded on the
balance sheet were as follows:
DEFERRED TAX ASSETS
(dollars in millions)
AT DECEMBER 31: 2000 1999
Employee benefits $«««3,673 $«««3,737
Alternative minimum tax credits 1,424 1,244
Bad debt, inventory and
warranty reserves 953 1,093
Capitalized research and development 848 880
Deferred income 837 870
General business credits 655 605
Infrastructure reduction charges 617 918
Foreign tax loss carryforwards 489 406
Equity alliances 437 377
Depreciation 376 326
State and local tax loss carryforwards 246 227
Intracompany sales and services 149 153
Other 2,809 2,763
Gross deferred tax assets 13,513 13,599
Less: Valuation allowance 572 647
Net deferred tax assets $«12,941 $«12,952
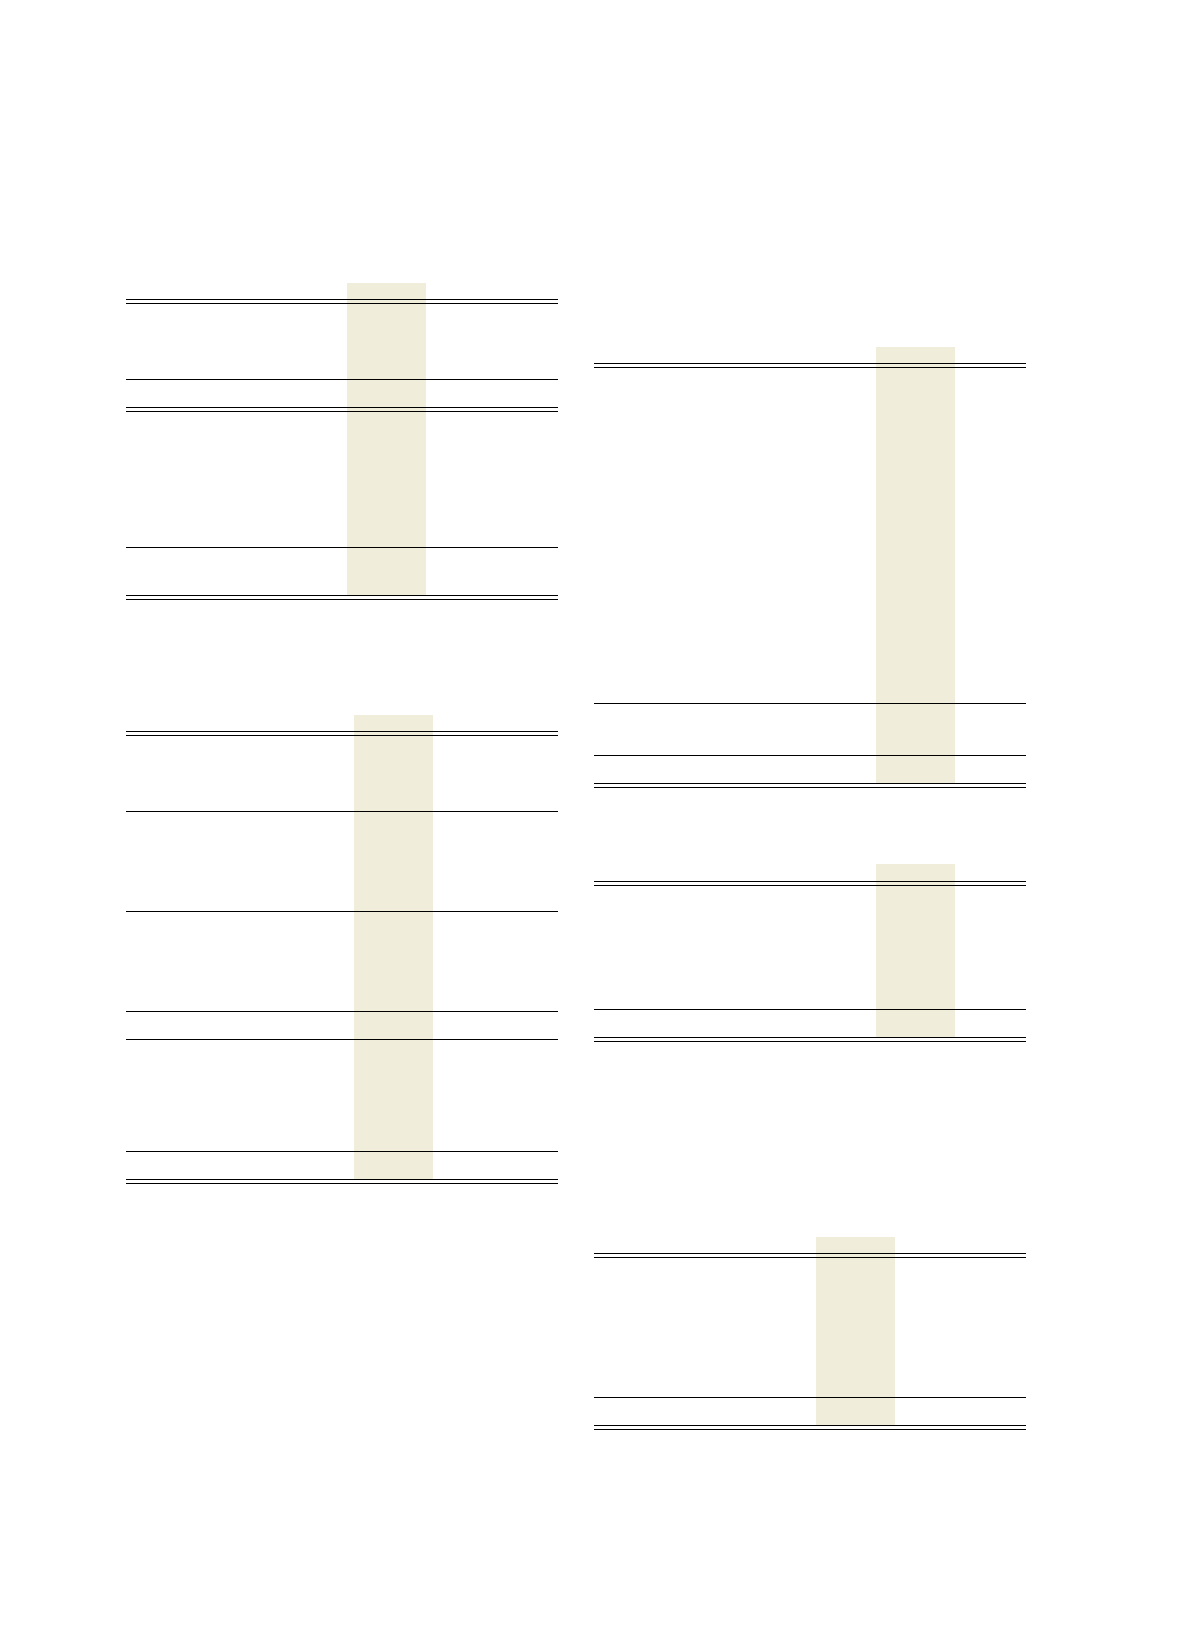
DEFERRED TAX LIABILITIES
(dollars in millions)
AT DECEMBER 31: 2000 1999
Retirement benefits $«««3,447 $«««3,092
Sales-type leases 2,450 2,914
Depreciation 1,179 1,237
Software costs deferred 306 250
Other 1,836 2,058
Gross deferred tax liabilities $«««9,218 $«««9,551
The valuation allowance at December 31, 2000, principally
applies to certain state and local, and foreign tax loss carry-
forwards that, in the opinion of management, are more likely
than not to expire before the company can use them.
A reconciliation of the company’s effective tax rate to the
statutory U.S. federal tax rate is as follows:
FOR THE YEAR ENDED
DECEMBER 31: 2000 1999 1998
Statutory rate 35% 35% 35%
Foreign tax differential (6) (2) (6)
State and local 111
Valuation allowance
related items (1) — (1)
Other 1— 1
Effective rate 30% 34% 30%