IBM 2000 Annual Report Download - page 94
Download and view the complete annual report
Please find page 94 of the 2000 IBM annual report below. You can navigate through the pages in the report by either clicking on the pages listed below, or by using the keyword search tool below to find specific information within the annual report.-
 1
1 -
2
-
3
-
4
-
5
-
6
-
7
-
8
-
9
-
10
-
11
-
12
-
13
-
14
-
15
-
16
-
17
-
18
-
19
-
20
-
21
-
22
-
23
-
24
-
25
-
26
-
27
-
28
-
29
-
30
-
31
-
32
-
33
-
34
-
35
-
36
-
37
-
38
-
39
-
40
-
41
-
42
-
43
-
44
-
45
-
46
-
47
-
48
-
49
-
50
-
51
-
52
-
53
-
54
-
55
-
56
-
57
-
58
-
59
-
60
-
61
-
62
-
63
-
64
-
65
-
66
-
67
-
68
-
69
-
70
-
71
-
72
-
73
-
74
-
75
-
76
-
77
-
78
-
79
-
80
-
81
-
82
-
83
-
 84
84 -
 85
85 -
 86
86 -
 87
87 -
 88
88 -
 89
89 -
 90
90 -
 91
91 -
 92
92 -
 93
93 -
 94
94 -
 95
95 -
 96
96 -
 97
97 -
 98
98 -
 99
99 -
 100
100
 |
 |

page no.
ninety-two
notes to consolidated financial statements
international business machines corporation
and Subsidiary Companies
Immaterial Items
INVESTMENT IN EQUITY ALLIANCES AND EQUITY
ALLIANCES GAINS/LOSSES
The investments in equity alliances and the resulting gains
and losses from these investments that are attributable to the
segments do not have a significant effect on the financial
results of the segments.
Segment Assets and Other Items
The assets of the hardware segments primarily are inventory
and plant, property and equipment. The software segment
assets mainly are plant, property and equipment, and invest-
ment in capitalized software. In the past, many of the assets
utilized in the Global Services segment were shared and
under ownership of the company’s geographic marketing and
distribution organizations and therefore were not included
in any of the segment asset amounts below. In 2000, the
assets discretely identifiable to and managed by the Global
Services segment have been allocated to the segment and are
reflected in the following table. Previously, these assets had
not been allocated to any of the segments. This change was
made in order to increase the level of focus and ownership
on services-managed assets and to provide a more appropri-
ate basis for business and competitive analysis. The assets
primarily are accounts receivable, maintenance inventory,
and plant, property and equipment including those associated
with the segment’s outsourcing business.
To accomplish the efficient use of the company’s space
and equipment, it usually is necessary for several segments to
share plant, property and equipment assets. Where assets are
shared, landlord ownership of the assets is assigned to one
segment and is not allocated to each user segment. This is
consistent with the company’s management system and is
reflected accordingly in the schedule below. In those cases,
there will not be a precise correlation between segment pre-
tax income and segment assets.
Similarly, the depreciation amounts reported by each
segment are based on the assigned landlord ownership and
may not be consistent with the amounts that are included in
the segments’ pre-tax income. The amounts that are
included in pre-tax income reflect occupancy charges from
the landlord segment and are not specifically identified by
the management reporting system.
Capital expenditures that are reported by each seg-
ment also are in line with the landlord ownership basis of
asset assignment.
The Global Financing segment amounts below for interest
income and interest expense reflect the interest income and
interest expense associated with the financing business, as well
as the income from the investment in cash and marketable
securities. Such Global Financing interest expense consists of
interest expense on external debt of the Global Financing busi-
ness, as well as interest expense on intercompany borrowings
from other units of the company. The remaining amounts of
interest income and interest expense under the caption “Total
Segments” are not discretely identified to the other segments,
but are included as part of an indirect expense allocation.
The segment information for 1999 and 1998 has been
reclassified to reflect the organizational changes, product
transfers between the segments and the aforementioned
Global Services asset reclassifications.
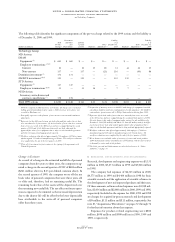
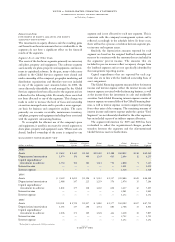
MANAGEMENT SYSTEM SEGMENT VIEW
Hardware
Personal Enterprise Global Global Enterprise Total
(dollars in millions) Technology Systems Systems Services Software Financing Investments Segments
2000:
Assets $«««9,632 $«2,442 $«3,141 $«10,492 $«2,488 $«40,822 $«246 $«69,263
Depreciation/amortization 1,074 156 409 1,243 665 2,696 12 6,255
Capital expenditures/
investment in software 1,754 193 302 1,311 770 2,898 9 7,237
Interest income —————3,051 — 3,051
Interest expense —————1,318 — 1,318
1999*:
Assets $«««9,459 $«1,611 $«3,596 $«««9,312 $«2,527 $«39,686 $«369 $«66,560
Depreciation/amortization 2,088 147 225 1,259 576 2,976 15 7,286
Capital expenditures/
investment in software 1,803 177 338 1,292 656 3,217 12 7,495
Interest income —————2,961 — 2,961
Interest expense —————1,232 — 1,232
1998*:
Assets $«10,191 $«1,729 $«2,957 $«««9,882 $«2,577 $«40,109 $«307 $«67,752
Depreciation/amortization 1,163 137 206 1,331 681 2,768 15 6,301
Capital expenditures/
investment in software 2,006 173 309 1,528 424 3,438 19 7,897
Interest income —————2,725 — 2,725
Interest expense —————1,252 — 1,252
*Reclassified to conform with 2000 presentation.