IBM 2000 Annual Report Download - page 61
Download and view the complete annual report
Please find page 61 of the 2000 IBM annual report below. You can navigate through the pages in the report by either clicking on the pages listed below, or by using the keyword search tool below to find specific information within the annual report.-
 1
1 -
2
-
3
-
4
-
5
-
6
-
7
-
8
-
9
-
10
-
11
-
12
-
13
-
14
-
15
-
16
-
17
-
18
-
19
-
20
-
21
-
22
-
23
-
24
-
25
-
26
-
27
-
28
-
29
-
30
-
31
-
32
-
33
-
34
-
35
-
36
-
37
-
38
-
39
-
40
-
41
-
42
-
43
-
44
-
45
-
46
-
47
-
48
-
49
-
50
-
 51
51 -
 52
52 -
 53
53 -
 54
54 -
 55
55 -
 56
56 -
 57
57 -
 58
58 -
 59
59 -
 60
60 -
 61
61 -
 62
62 -
 63
63 -
 64
64 -
 65
65 -
 66
66 -
 67
67 -
 68
68 -
 69
69 -
 70
70 -
 71
71 -
72
-
73
-
74
-
75
-
76
-
77
-
78
-
79
-
80
-
81
-
82
-
83
-
84
-
85
-
86
-
87
-
88
-
89
-
90
-
91
-
92
-
93
-
94
-
95
-
96
-
97
-
98
-
99
-
100
 |
 |
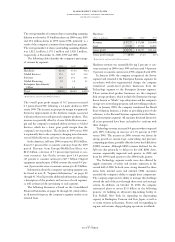
FINANCIAL CONDITION
During 2000, the company continued to demonstrate strong
financial performance, enabling it to make significant invest-
ments to fund future growth and increase shareholder value
without increasing its non-global financing debt. The com-
pany spent $5,645 million for research, development and
engineering, excluding $9 million of IPR&D; $4,360 million
for plant and other property, including machines used in
strategic outsourcing contracts; $1,256 million for machines
on operating leases with customers; and $6,659 million for
the repurchase of the company’s common shares. In addition,
of the company’s nine acquisitions in 2000, the company
paid cash totaling approximately $300 million of the aggregate
$511 million purchase price. The company had $3,722 million
in cash and cash equivalents and current marketable securities
at December 31, 2000. The company’s debt levels remained
essentially flat with a small increase in Global Financing
debt, offset by a decline in non-global financing debt.
The company maintains a $10 billion committed global
credit facility that expires in February 2002. As of Dec-
ember 31, 2000 and 1999, $9.1 billion and $8.6 billion were
unused and available, respectively. In addition, the company
had outstanding other committed and uncommitted lines
of credit of approximately $4.7 billion and $5.5 billion as
of December 31, 2000 and 1999, respectively. As of
December 31, 2000 and 1999, $4.1 billion and $4.5 billion
were unused and available, respectively.
The company managed assets of $136 million and $273
million at December 31, 2000 and 1999, respectively, from
the securitization of loans, leases and trade receivables. For
additional information, see note I, “Sale and Securitization
of Receivables,” on page 74.
The changes in the company’s U.S. pension plan, including
the increased benefits for retirees and the 1999 amendment
to the plan, are not expected to have a material effect on the
company’s financial condition.
The major rating agencies’ ratings of the company’s debt
securities and preferred stock as of December 31, 2000,
appear in the table below:
Standard Moody’s
and Investors
Poor’s Service Fitch, Inc.
Senior long-term debt A+ A1 AA-
Commercial paper A-1 Prime-1 F-1+
Preferred stock Aa1A+
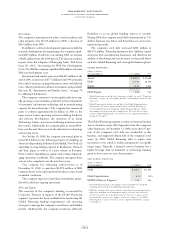
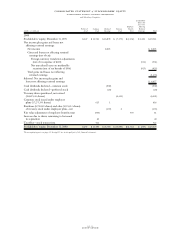
Cash Flows
The company’s cash flows from operating, investing and
financing activities, as reflected in the Consolidated State-
ment of Cash Flows on page 68, are summarized in the
following table:
(dollars in millions) 2000 1999 1998
Net cash provided from/
(used in):
Operating activities $««9,274 $«10,111 $««««9,273
Investing activities (4,248) (1,669) (6,131)
Financing activities (6,359) (8,625) (4,993)
Effect of exchange rate
changes on cash and
cash equivalents (147) (149) 120
Net change in cash and
cash equivalents $«(1,480) $«««««(332) $«««(1,731)
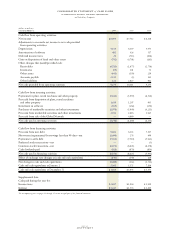
Working Capital
(dollars in millions)
AT DECEMBER 31: 2000 1999
Current assets $«43,880 $«43,155
Current liabilities 36,406 39,578
Working capital $÷«7,474 $«««3,577
Current ratio 1.21:1 1.09:1
Current assets increased $725 million due primarily to an
increase in accounts receivable of $3,108 million, offset by
decreases of $2,109 million in cash and cash equivalents and
current marketable securities, and $206 million in deferred
taxes. The increase in accounts receivable was due to strong
year-end business volumes and global financing activity in
the software and services businesses across all geographies.
The decrease in cash and cash equivalents and current mar-
ketable securities resulted primarily from stock repurchases
and capital expenditures, partially offset by cash generated
from operations.
The company ended 2000 with inventories of $4,765 mil-
lion, the lowest level since 1983, primarily a result of lower
inventory levels within Enterprise Systems segment and
Microelectronics Division, and currency translation on inven-
tories outside the United States. The company’s inventory
turnover ratio improved to 6.3 in 2000 from 5.9 in 1999.
Current liabilities declined $3,172 million from year-end
1999, primarily due to decreases of $4,025 million in short-
term debt and $922 million in other accrued expenses and
liabilities, offset by an increase in accounts payable of $1,792
million. The increase was primarily due to strong year-end
business volumes, primarily in the Enterprise Systems seg-
ment, across all geographies.
management discussion
international business machines corporation
and Subsidiary Companies
page no.
fifty-nine