IBM 2000 Annual Report Download - page 93
Download and view the complete annual report
Please find page 93 of the 2000 IBM annual report below. You can navigate through the pages in the report by either clicking on the pages listed below, or by using the keyword search tool below to find specific information within the annual report.-
 1
1 -
2
-
3
-
4
-
5
-
6
-
7
-
8
-
9
-
10
-
11
-
12
-
13
-
14
-
15
-
16
-
17
-
18
-
19
-
20
-
21
-
22
-
23
-
24
-
25
-
26
-
27
-
28
-
29
-
30
-
31
-
32
-
33
-
34
-
35
-
36
-
37
-
38
-
39
-
40
-
41
-
42
-
43
-
44
-
45
-
46
-
47
-
48
-
49
-
50
-
51
-
52
-
53
-
54
-
55
-
56
-
57
-
58
-
59
-
60
-
61
-
62
-
63
-
64
-
65
-
66
-
67
-
68
-
69
-
70
-
71
-
72
-
73
-
74
-
75
-
76
-
77
-
78
-
79
-
80
-
81
-
82
-
 83
83 -
 84
84 -
 85
85 -
 86
86 -
 87
87 -
 88
88 -
 89
89 -
 90
90 -
 91
91 -
 92
92 -
 93
93 -
 94
94 -
 95
95 -
 96
96 -
 97
97 -
 98
98 -
 99
99 -
 100
100
 |
 |

page no.
ninety-one
notes to consolidated financial statements
international business machines corporation
and Subsidiary Companies
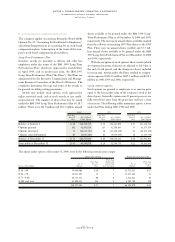
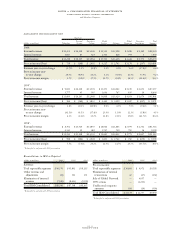
(dollars in millions) 2000 1999*1998*
Pre-tax income:
Total reportable segments $«10,891 $«««9,971 $«9,558
Elimination of internal
transactions 62 (47) (162)
Sale of Global Network — 4,057 —
1999 actions — (2,205) —
Unallocated corporate
amounts 581 (19) (356)
Total IBM Consolidated $«11,534 $«11,757 $«9,040
*Reclassified to conform with 2000 presentation.
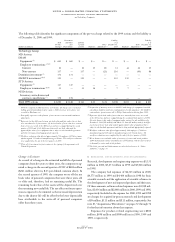
MANAGEMENT SYSTEM SEGMENT VIEW
Hardware
Personal Enterprise Global Global Enterprise Total
(dollars in millions) Technology Systems Systems Services Software Financing Investments Segments
2000:
External revenue $«10,221 $«16,250 $«11,340 $«33,152 $«12,598 $«3,500 $«1,369 $«88,430
Internal revenue 3,017 85 624 2,439 828 944 3 7,940
Total revenue $«13,238 $«16,335 $«11,964 $«35,591 $«13,426 $«4,444 $«1,372 $«96,370
Pre-tax income/(loss) $««««««758 $÷÷«(148) $«««2,092 $÷«4,517 $«««2,793 $«1,176 $«««(297) $«10,891
Revenue year-to-year change (2.7) % 1.1% (0.9) % 2.2% 0.0% 9.6% (17.8) % 0.6%
Pre-tax income year-
to-year change 29.4% 58.9% 14.2% 1.2% (9.9) % 12.3% 57.4% 9.2%
Pre-tax income margin 5.7% (0.9) % 17.5% 12.7% 20.8% 26.5% (21.6) % 11.3%
1999 *:
External revenue $÷«9,832 $«16,118 $«11,503 $«32,172 $«12,662 $«3,219 $«1,651 $«87,157
Internal revenue 3,777 45 565 2,636 767 835 19 8,644
Total revenue $«13,609 $«16,163 $«12,068 $«34,808 $«13,429 $«4,054 $«1,670 $«95,801
Pre-tax income/(loss) $««««««586 $÷÷«(360) $«««1,832 $÷«4,464 $«««3,099 $«1,047 $«««(697) $«««9,971
Revenue year-to-year change 2.8% 20.2% (16.9) % 9.9% 6.5% 7.5% (9.6) % 5.1%
Pre-tax income year-
to-year change (41.3) % 63.5% (37.4) % 23.9% 13.0% 12.3% (5.8) % 4.3%
Pre-tax income margin 4.3% (2.2) % 15.2% 12.8% 23.1% 25.8% (41.7) % 10.4%
1998 *:
External revenue «$«÷8,701 $«13,419 $«13,847 $«28,916 $«11,863 $«2,979 $«1,791 $«81,516
Internal revenue 4,543 29 683 2,747 749 792 56 9,599
Total revenue $«13,244 $«13,448 $«14,530 $«31,663 $«12,612 $«3,771 $«1,847 $«91,115
Pre-tax income/(loss) $««««««998 $÷÷«(986) $«««2,928 $«««3,603 $«««2,742 $««««932 $÷«(659) $÷«9,558
Pre-tax income margin 7.5% (7.3) % 20.2% 11.4% 21.7% 24.7% (35.7) % 10.5%
*Reclassified to conform with 2000 presentation.
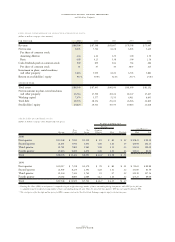
Reconciliations to IBM as Reported
(dollars in millions) 2000 1999*1998*
Revenue:
Total reportable segments $«96,370 $«95,801 $«91,115
Other revenue and
adjustments (34) 391 151
Elimination of internal
revenue (7,940) (8,644) (9,599)
Total IBM Consolidated $«88,396 $«87,548 $«81,667
*Reclassified to conform with 2000 presentation.