IBM 2000 Annual Report Download - page 70
Download and view the complete annual report
Please find page 70 of the 2000 IBM annual report below. You can navigate through the pages in the report by either clicking on the pages listed below, or by using the keyword search tool below to find specific information within the annual report.-
 1
1 -
2
-
3
-
4
-
5
-
6
-
7
-
8
-
9
-
10
-
11
-
12
-
13
-
14
-
15
-
16
-
17
-
18
-
19
-
20
-
21
-
22
-
23
-
24
-
25
-
26
-
27
-
28
-
29
-
30
-
31
-
32
-
33
-
34
-
35
-
36
-
37
-
38
-
39
-
40
-
41
-
42
-
43
-
44
-
45
-
46
-
47
-
48
-
49
-
50
-
51
-
52
-
53
-
54
-
55
-
56
-
57
-
58
-
59
-
 60
60 -
 61
61 -
 62
62 -
 63
63 -
 64
64 -
 65
65 -
 66
66 -
 67
67 -
 68
68 -
 69
69 -
 70
70 -
 71
71 -
 72
72 -
 73
73 -
 74
74 -
 75
75 -
 76
76 -
 77
77 -
 78
78 -
 79
79 -
 80
80 -
81
-
82
-
83
-
84
-
85
-
86
-
87
-
88
-
89
-
90
-
91
-
92
-
93
-
94
-
95
-
96
-
97
-
98
-
99
-
100
 |
 |
page no.
sixty-eight
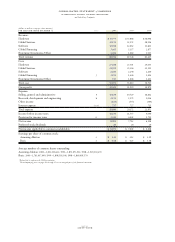
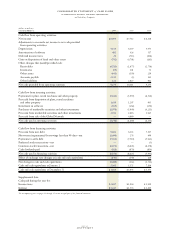
consolidated statement of cash flows
international business machines corporation
and Subsidiary Companies
(dollars in millions)
AT DECEMBER 31: 2000 1999 1998
Cash flow from operating activities:
Net income $«8,093 $«7,712 $«6,328
Adjustments to reconcile net income to net cash provided
from operating activities:
Depreciation 4,513 6,159 4,475
Amortization of software 482 426 517
Deferred income taxes 29 (713) (606)
Gain on disposition of fixed and other assets (792) (4,791) (261)
Other changes that (used)/provided cash:
Receivables (4,720) (1,677) (2,736)
Inventories (55) 301 73
Other assets (643) (130) 219
Accounts payable 2,245 (3) 362
Other liabilities 122 2,827 902
Net cash provided from operating activities 9,274 10,111 9,273
Cash flow from investing activities:
Payments for plant, rental machines and other property (5,616) (5,959) (6,520)
Proceeds from disposition of plant, rental machines
and other property 1,619 1,207 905
Investment in software (565) (464) (250)
Purchases of marketable securities and other investments (1,079) (3,949) (4,211)
Proceeds from marketable securities and other investments 1,393 2,616 3,945
Proceeds from sale of the Global Network — 4,880 —
Net cash used in investing activities (4,248) (1,669) (6,131)
Cash flow from financing activities:
Proceeds from new debt 9,604 6,133 7,567
Short-term (repayments)/ borrowings less than 90 days
—
net (1,400) 276 499
Payments to settle debt (7,561) (7,510) (5,942)
Preferred stock transactions
—
net — — (5)
Common stock transactions
—
net (6,073) (6,645) (6,278)
Cash dividends paid (929) (879) (834)
Net cash used in financing activities (6,359) (8,625) (4,993)
Effect of exchange rate changes on cash and cash equivalents (147) (149) 120
Net change in cash and cash equivalents (1,480) (332) (1,731)
Cash and cash equivalents at January 1 5,043 5,375 7,106
Cash and cash equivalents at December 31 $«3,563 $«5,043 $«5,375
Supplemental data:
Cash paid during the year for:
Income taxes $«2,697 $«1,904 $«1,929
Interest $«1,447 $«1,574 $«1,605
The accompanying notes on pages 69 through 93 are an integral part of the financial statements.