IBM 2000 Annual Report Download - page 92
Download and view the complete annual report
Please find page 92 of the 2000 IBM annual report below. You can navigate through the pages in the report by either clicking on the pages listed below, or by using the keyword search tool below to find specific information within the annual report.-
 1
1 -
2
-
3
-
4
-
5
-
6
-
7
-
8
-
9
-
10
-
11
-
12
-
13
-
14
-
15
-
16
-
17
-
18
-
19
-
20
-
21
-
22
-
23
-
24
-
25
-
26
-
27
-
28
-
29
-
30
-
31
-
32
-
33
-
34
-
35
-
36
-
37
-
38
-
39
-
40
-
41
-
42
-
43
-
44
-
45
-
46
-
47
-
48
-
49
-
50
-
51
-
52
-
53
-
54
-
55
-
56
-
57
-
58
-
59
-
60
-
61
-
62
-
63
-
64
-
65
-
66
-
67
-
68
-
69
-
70
-
71
-
72
-
73
-
74
-
75
-
76
-
77
-
78
-
79
-
80
-
81
-
 82
82 -
 83
83 -
 84
84 -
 85
85 -
 86
86 -
 87
87 -
 88
88 -
 89
89 -
 90
90 -
 91
91 -
 92
92 -
 93
93 -
 94
94 -
 95
95 -
 96
96 -
 97
97 -
 98
98 -
 99
99 -
 100
100
 |
 |

page no.
ninety
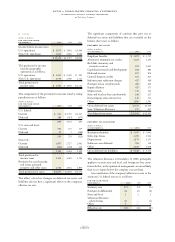
notes to consolidated financial statements
international business machines corporation
and Subsidiary Companies
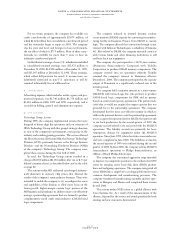
Services, Site and Connectivity Services, and Systems
Management and Networking Services. Learning Services
supports the three primary lines of business and helps cus-
tomers design, develop and deploy curricula to educate their
employees. The Global Services segment is uniquely suited
to integrate the full range of the company’s and key industry
participants’ capabilities, including hardware, software,
services and research.
The Software segment delivers operating systems for the
company’s servers and e-business enabling software (middle-
ware) for IBM and non-IBM platforms. The segment’s
business offerings align with key customer opportunity
areas
—
transformation and integration, leveraging informa-
tion, organizational effectiveness and managing technology.
In addition to its own development, product and marketing
effort, the segment supports more than 35,000 Independent
Software Vendors to ensure that the company’s software and
hardware offerings are included in those partners’ solutions.
The Global Financing segment is the world’s largest
provider of financing services for I/T. The segment provides
lease and loan financing that enables the company’s customers
to acquire complete I/T and e-business solutions
—
hardware,
software and services
—
provided by the company and its
business partners. Global Financing, as a reliable source
of capital for the distribution channel, also provides the
company’s business partners with customized commercial
financing for inventory, accounts receivable and term loans,
helping them manage their cash flow, invest in infrastructure
and grow their business.
The Enterprise Investments segment provides industry-
specific information technology solutions, supporting the
hardware, software and services segments of the company.
The segment develops unique products designed to meet
specific marketplace requirements and to complement the
company’s overall portfolio of products.
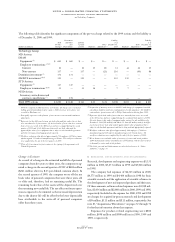
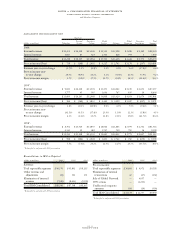
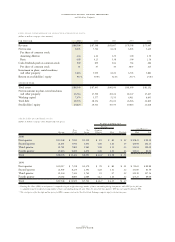
Segment revenue and pre-tax income include transactions
between the segments that are intended to reflect an arm’s-
length transfer price. Specifically, semiconductors and
HDDs are sourced internally from the Technology segment
for use in the manufacture of the Enterprise Systems segment
and Personal Systems segment products. In addition, tech-
nology, hardware and software that are used by the Global
Services segment in outsourcing engagements are sourced
internally from the Technology, Enterprise Systems,
Personal Systems and Software segments. For the internal
use of information technology services, the Global Services
segment recovers cost, as well as a reasonable fee reflecting
the arm’s-length value of providing the services. The Global
Services segment enters into arm’s-length leases at prices
equivalent to market rates with the Global Financing segment
to facilitate the acquisition of equipment used in outsourcing
engagements. Generally, all internal transaction prices are
reviewed and reset annually if appropriate.
The company uses shared-resources concepts to realize
economies of scale and efficient use of resources. Thus, a
considerable amount of expense is shared by all of the com-
pany’s segments. This expense represents sales coverage,
marketing and support functions such as Accounting,
Treasury, Procurement, Legal, Human Resources, and
Billing and Collections. Where practical, shared expenses
are allocated based on measurable drivers of expense, e.g.,
headcount. When a clear and measurable driver cannot be
identified, shared expenses are allocated on a financial basis
that is consistent with the company’s management system;
e.g., image advertising is allocated based on the gross profit
of the segments. In the first quarter of 2000, the company
decided to allocate to specific segments certain expense
items that previously were unallocated (certain infrastructure
reductions and currency exchange gains and losses). The
company also enhanced its pre-existing practice of allocating
shared expenses, where practical, based on measurable drivers
of expense to give a more precise representation of the
expenses that are associated with each segment. The unallo-
cated corporate amounts arising from certain acquisitions,
indirect infrastructure reductions and certain intellectual
property income are recorded in net income but are not
allocated to the segments.
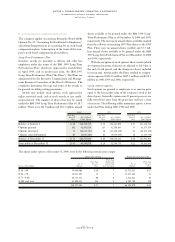
The following tables reflect the results of the segments
consistent with the company’s management system. These
results are not necessarily a depiction that is in conformity
with generally accepted accounting principles; e.g.,
employee retirement plan costs are developed using actuarial
assumptions on a country-by-country basis and allocated to
the segments on headcount. Different amounts could result
if actuarial assumptions that are unique to the segment were
used. Performance measurement is based on income before
income taxes (pre-tax income). These results are used, in
part, by management, both in evaluating the performance of,
and in allocating resources to, each of the segments. The
results for 1999 and 1998 have been reclassified to reflect the
organizational changes, product transfers and expense allo-
cation changes made in 2000.