IBM 2000 Annual Report Download - page 11
Download and view the complete annual report
Please find page 11 of the 2000 IBM annual report below. You can navigate through the pages in the report by either clicking on the pages listed below, or by using the keyword search tool below to find specific information within the annual report.-
 1
1 -
 2
2 -
 3
3 -
 4
4 -
 5
5 -
 6
6 -
 7
7 -
 8
8 -
 9
9 -
 10
10 -
 11
11 -
 12
12 -
 13
13 -
 14
14 -
 15
15 -
 16
16 -
 17
17 -
 18
18 -
 19
19 -
 20
20 -
 21
21 -
 22
22 -
23
-
24
-
25
-
26
-
27
-
28
-
29
-
30
-
31
-
32
-
33
-
34
-
35
-
36
-
37
-
38
-
39
-
40
-
41
-
42
-
43
-
44
-
45
-
46
-
47
-
48
-
49
-
50
-
51
-
52
-
53
-
54
-
55
-
56
-
57
-
58
-
59
-
60
-
61
-
62
-
63
-
64
-
65
-
66
-
67
-
68
-
69
-
70
-
71
-
72
-
73
-
74
-
75
-
76
-
77
-
78
-
79
-
80
-
81
-
82
-
83
-
84
-
85
-
86
-
87
-
88
-
89
-
90
-
91
-
92
-
93
-
94
-
95
-
96
-
97
-
98
-
99
-
100
 |
 |
page no.
nine
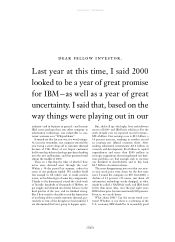
chairman’s foreword
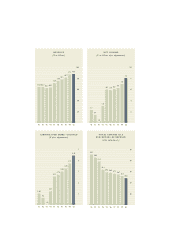
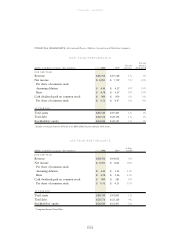
one-year performance
six-year performance
Percent
Percent Increase
(dollars in millions except per share amounts) 2000 1999 Increase Normalized
FOR THE YEAR
Revenue $«88,396 $«87,548 1% 1%
Net income $«««8,093 $«««7,712*5% *16%
Per share of common stock
:
Assuming dilution $«««««4.44 $«««««4.12*8% *19%
Basic $«««««4.58 $«««««4.25*8% *19%
Cash dividends paid on common stock $««««««909 $««««««859 6% 6%
Per share of common stock $«««««0.51 $«««««0.47 9% 9%
AT YEAR END
Total assets $«88,349 $«87,495 1% 1%
Total debt $«28,576 $«28,354 1% 1%
Stockholders’ equity $«20,624 $«20,511 1% 1%
* Includes a net benefit from the 1999 sale of the IBM Global Network and other 1999 actions.
6-Year
(dollars in millions except per share amounts) 2000 1994 CAGR**
FOR THE YEAR
Revenue $«88,396 $«64,052 6%
Net income $«««8,093 $«««3,021 18%
Per share of common stock
:
Assuming dilution $«««««4.44 $«««««1.24 24%
Basic $«««««4.58 $«««««1.26 24%
Cash dividends paid on common stock $««««««909 $««««««585 8%
Per share of common stock $«««««0.51 $«««««0.25 13%
AT YEAR END
Total assets $«88,349 $«81,091 1%
Total debt $«28,576 $«22,118 4%
Stockholders’ equity $«20,624 $«23,413 -2%
** Compound Annual Growth Rate
financial highlights
—
International Business Machines Corporation and Subsidiary Companies