IBM 2000 Annual Report Download - page 55
Download and view the complete annual report
Please find page 55 of the 2000 IBM annual report below. You can navigate through the pages in the report by either clicking on the pages listed below, or by using the keyword search tool below to find specific information within the annual report.
page no.
fifty-three
management discussion
international business machines corporation
and Subsidiary Companies
The average number of common shares outstanding assuming
dilution was lower by 59.0 million shares in 2000 versus 1999
and 49.1 million shares in 1999 versus 1998, primarily as a
result of the company’s common share repurchase program.
The average number of shares outstanding assuming dilution
was 1,812.1 million, 1,871.1 million and 1,920.1 million,
respectively, at December 31, 2000, 1999 and 1998.
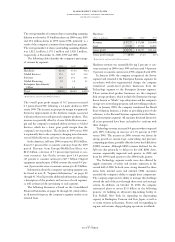
The following table identifies the company’s percentage
of revenue by segment:
2000 1999*1998*
Hardware 42.7% 43.3% 44.2%
Global Services 37.5 36.7 35.4
Software 14.3 14.5 14.5
Global Financing 3.9 3.6 3.5
Enterprise Investments/
Other 1.6 1.9 2.4
Total 100.0% 100.0% 100.0%
*Reclassified to conform with 2000 presentation.
The overall gross profit margin of 36.7 percent increased
0.3 points from 1999, following a 1.4 point decline in 1999
versus 1998. The increase in gross profit margin was primarily
driven by improvement in the hardware margin associated
with microelectronics and personal computer products. This
increase was partially offset by a lower Global Services mar-
gin and the company’s continued shift in revenue to Global
Services, which has a lower gross profit margin than the
company’s server products. The decline in 1999 versus 1998
was primarily due to the company’s changing mix of revenue
toward Global Services and away from server products.
In the Americas, full-year 2000 revenue was $38.6 billion,
down 0.5 percent (flat at constant currency) from the 1999
period. Revenue from Europe/Middle East/Africa was
$24.3 billion, a decrease of 5.3 percent (up 6 percent at con-
stant currency). Asia Pacific revenue grew 16.4 percent
(15 percent at constant currency) to $17.7 billion. Original
equipment manufacturer (OEM) revenue decreased 0.9 per-
cent (1 percent decrease at constant currency) to $7.8 billion.
Information about the company’s operating segments can
be found in note X, “Segment Information,” on pages 89
through 93. Note X provides additional information, including
a description of the products and services of each segment,
as well as financial data pertaining to each segment.
The following discussion is based on the Consolidated
Financial Statements on pages 64 through 68, which reflect,
in all material respects, the company’s segment results on an
external basis.
Hardware
(dollars in millions) 2000 1999*1998*
Revenue $«37,777 $«37,888 $«36,096
Cost 27,038 27,591 24,653
Gross profit $«10,739 $«10,297 $«11,443
Gross profit margin 28.4% 27.2% 31.7%
*Reclassified to conform with 2000 presentation.
Hardware revenue was essentially flat (up 2 percent at con-
stant currency) in 2000 versus 1999 and increased 5.0 percent
(5 percent at constant currency) in 1999 compared with 1998.
In January 2000, the company reorganized the Server
segment and renamed it the Enterprise Systems segment. In
accordance with that organizational change, the company
transferred system-level product businesses from the
Technology segment to the Enterprise Systems segment.
Those system-level product businesses are the company’s
disk storage products, which include the Enterprise Storage
Server known as “Shark,” tape subsystems and the company’s
storage area networking program, and networking products.
Also, in January 2000, the company transferred the Retail
Store Solutions business, a leader in providing point-of-sale
solutions, to the Personal Systems segment from the Enter-
prise Investments segment. All amounts disclosed herein for
all years presented have been reclassified to conform with
these changes.
Technology revenue increased 4.0 percent when compared
with 1999, following an increase of 13.0 percent in 1999
versus 1998. The increase in 2000 revenue was driven by
strong growth in custom logic, networking and pervasive
computing products, partially offset by lower hard disk drive
(HDD) revenue. Although HDD revenue declined for the
full year due primarily to delays in the 10K RPM drive,
revenue sequentially improved each quarter in 2000 and
from the 1999 fourth quarter to the 2000 fourth quarter.
The Technology segment results were also affected by
supply constraints of wafers and ceramic substrates in the
second half of 2000. In both cases, strong demand for these
items from internal users and external OEM customers
exceeded the company’s ability to supply these components.
The company improved its ability to manage this challenge
toward the end of the year through short-term and strategic
actions. In addition, on October 10, 2000, the company
announced plans to invest $5.0 billion in the following
projects: (1) building an advanced chip-making facility in
East Fishkill, New York; (2) expanding its chip-making
capacity in Burlington, Vermont and Yasu, Japan, as well as
at a joint venture in Essonnes, France; and (3) expanding its
organic and ceramic chip-packaging operations worldwide.


