IBM 2000 Annual Report Download - page 66
Download and view the complete annual report
Please find page 66 of the 2000 IBM annual report below. You can navigate through the pages in the report by either clicking on the pages listed below, or by using the keyword search tool below to find specific information within the annual report.-
 1
1 -
2
-
3
-
4
-
5
-
6
-
7
-
8
-
9
-
10
-
11
-
12
-
13
-
14
-
15
-
16
-
17
-
18
-
19
-
20
-
21
-
22
-
23
-
24
-
25
-
26
-
27
-
28
-
29
-
30
-
31
-
32
-
33
-
34
-
35
-
36
-
37
-
38
-
39
-
40
-
41
-
42
-
43
-
44
-
45
-
46
-
47
-
48
-
49
-
50
-
51
-
52
-
53
-
54
-
55
-
 56
56 -
 57
57 -
 58
58 -
 59
59 -
 60
60 -
 61
61 -
 62
62 -
 63
63 -
 64
64 -
 65
65 -
 66
66 -
 67
67 -
 68
68 -
 69
69 -
 70
70 -
 71
71 -
 72
72 -
 73
73 -
 74
74 -
 75
75 -
 76
76 -
77
-
78
-
79
-
80
-
81
-
82
-
83
-
84
-
85
-
86
-
87
-
88
-
89
-
90
-
91
-
92
-
93
-
94
-
95
-
96
-
97
-
98
-
99
-
100
 |
 |

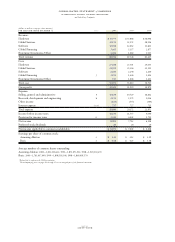
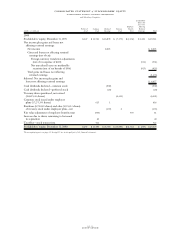
consolidated statement of earnings
international business machines corporation
and Subsidiary Companies
page no.
sixty-four
(dollars in millions except per share amounts)
FOR THE YEAR ENDED DECEMBER 31: Notes 2000 1999*1998*
Revenue:
Hardware $«37,777 $«37,888 $«36,096
Global Services 33,152 32,172 28,916
Software 12,598 12,662 11,863
Global Financing 3,465 3,137 2,877
Enterprise Investments /Other 1,404 1,689 1,915
Total revenue 88,396 87,548 81,667
Cost:
Hardware 27,038 27,591 24,653
Global Services 24,309 23,304 21,125
Software 2,283 2,240 2,260
Global Financing J1,595 1,446 1,494
Enterprise Investments/Other 747 1,038 1,263
Total cost 55,972 55,619 50,795
Gross profit 32,424 31,929 30,872
Expense:
Selling, general and administrative p15,639 14,729 16,662
Research, development and engineering R5,151 5,273 5,046
Other income (617) (557) (589)
Interest expense J & K 717 727 713
Total expense 20,890 20,172 21,832
Income before income taxes 11,534 11,757 9,040
Provision for income taxes O3,441 4,045 2,712
Net income 8,093 7,712 6,328
Preferred stock dividends 20 20 20
Net income applicable to common stockholders $«««8,073 $«««7,692 $÷«6,308
Earnings per share of common stock:
Assuming dilution S$«««««4.44 $««÷«4.12 $«÷««3.29
Basic S$«««««4.58 $«÷««4.25 $«÷««3.38
Average number of common shares outstanding:
Assuming dilution: 2000
—
1,812,118,422; 1999
—
1,871,073,912; 1998
—
1,920,130,470
Basic: 2000
—
1,763,037,049; 1999
—
1,808,538,346; 1998
—
1,869,005,570
*Reclassified to conform with 2000 presentation.
The accompanying notes on pages 69 through 93 are an integral part of the financial statements.