IBM 2000 Annual Report Download - page 57
Download and view the complete annual report
Please find page 57 of the 2000 IBM annual report below. You can navigate through the pages in the report by either clicking on the pages listed below, or by using the keyword search tool below to find specific information within the annual report.-
 1
1 -
2
-
3
-
4
-
5
-
6
-
7
-
8
-
9
-
10
-
11
-
12
-
13
-
14
-
15
-
16
-
17
-
18
-
19
-
20
-
21
-
22
-
23
-
24
-
25
-
26
-
27
-
28
-
29
-
30
-
31
-
32
-
33
-
34
-
35
-
36
-
37
-
38
-
39
-
40
-
41
-
42
-
43
-
44
-
45
-
46
-
 47
47 -
 48
48 -
 49
49 -
 50
50 -
 51
51 -
 52
52 -
 53
53 -
 54
54 -
 55
55 -
 56
56 -
 57
57 -
 58
58 -
 59
59 -
 60
60 -
 61
61 -
 62
62 -
 63
63 -
 64
64 -
 65
65 -
 66
66 -
 67
67 -
68
-
69
-
70
-
71
-
72
-
73
-
74
-
75
-
76
-
77
-
78
-
79
-
80
-
81
-
82
-
83
-
84
-
85
-
86
-
87
-
88
-
89
-
90
-
91
-
92
-
93
-
94
-
95
-
96
-
97
-
98
-
99
-
100
 |
 |

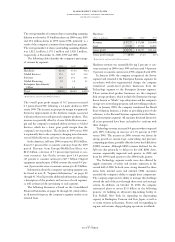
Global Services revenue increased 3.0 percent (6 percent
at constant currency) in 2000 over 1999 and 11.3 percent (11
percent at constant currency) in 1999 over 1998. Revenue
comparisons in 2000 were adversely affected by two events:
the sale of the Global Network to AT&T in 1999 and the
decline in Y2Kservices activity year over year. After adjusting
for those two factors, Global Services revenue (excluding
maintenance) increased 9 percent in 2000 and 17 percent in
1999. (See note D, “Acquisitions/Divestitures,” on pages 72
through 74 for additional information about the Global
Network sale.) Maintenance revenue was flat in 2000 when
compared to 1999 and declined 1 percent in 1999 versus 1998.
Strategic Outsourcing Services and Integrated Technology
Services were the major contributors to the revenue growth
in 2000 and 1999. Strategic Outsourcing Services continued
to demonstrate good revenue growth in 2000 as compared to
1999, with particularly strong growth in Asia Pacific. Inte-
grated Technology Services benefited from growth in OEM
alliance revenue, especially as related to Cisco Systems
products. These increases were partially offset by the loss of
revenue due to the sale of the Global Network and lower
revenue growth from Business Innovation Services primarily
resulting from the decline in Y2Kactivity. Business Innovation
Services recovered in the second half of 2000 as customers
shifted from mature offerings such as custom systems inte-
gration and Y2Kremediation to the company’s e-business
offerings. Business Innovation Services revenue, exclusive of
Y2Kand custom systems integration, experienced strong
growth in 2000.
e-business spans many of the Global Services offerings
and contributed significantly to 2000 performance. The
company’s total discrete e-business revenue grew more than
70 percent to approximately $5 billion in 2000. This increase
was driven by e-commerce consulting, e-business enablement
and e-hosting services.
In 2000, the company signed contracts totaling $55 bil-
lion, including 60 contracts in excess of $100 million, 6 of
which exceeded $1 billion. These transactions contributed to
a services backlog at December 31, 2000, of $85 billion com-
pared with $60 billion at December 31, 1999. The company
continued to meet the demand for its services by hiring more
than 19,000 employees in 2000 and 17,000 employees in 1999.
Global Services gross profit dollars were essentially flat in
2000 compared to 1999 and increased 13.8 percent in 1999
versus 1998. The decline in gross profit margin in 2000 of
0.9 points was driven by lower utilization rates in Business
Innovation Services and Integrated Technology Services due
to rapid hiring and retraining associated with rebalancing
skills toward e-business services. Also contributing to the
decline was a revenue shift to OEM alliances, which have a
lower gross profit margin. The maintenance gross profit mar-
gin improved 0.6 points in 2000 versus 1999 due to continued
productivity improvements and effective cost management.
Global Services gross profit dollars and gross profit
margins improved in 1999 as compared with 1998 due to
significant productivity improvements that more than offset
competitive pressures and the negative effect of the chang-
ing mix of services and maintenance within the Global
Services portfolio.
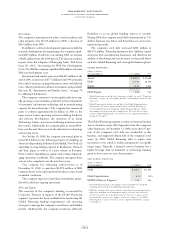
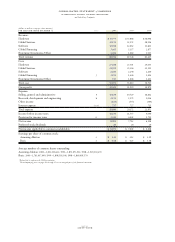
Software
(dollars in millions) 2000 1999 1998
Revenue $«12,598 $«12,662 $«11,863
Cost 2,283 2,240 2,260
Gross profit $«10,315 $«10,422 $«««9,603
Gross profit margin 81.9% 82.3% 80.9%
Software revenue declined 0.5 percent (up 4 percent at
constant currency) in 2000 from 1999, following an increase
of 6.7 percent (8 percent at constant currency) from 1998.
The company’s middleware products had revenue growth of
3 percent in 2000 and 12 percent in 1999. Middleware
comprises data management, transaction processing, Tivoli
systems management and Lotus Notes messaging and
collaboration for both IBM and non-IBM platforms. This
growth was driven by the company’s key products on UNIX
and Windows NT platforms, led by WebSphere (Web appli-
cation server software), MQSeries (business integration
software) and DB2 (data management) offerings. These
increases in middleware revenue were partially offset by
revenue declines for Tivoli products as they were affected by
a transition in the systems management software marketplace.
The company continues to focus on helping customers use
its software to transform their businesses to e-businesses,
particularly in collaboration with the company’s Global
Services offerings, Independent Software Vendors, Web
integrators and other service providers.
Operating systems software revenue declined 9 percent in
2000 and 4 percent in 1999 when compared with the previous
period. The decline in 2000 was driven by lower revenue
associated with eSeries servers and legacy products. The
1999 decline was driven by lower AS/400 revenue.
Software gross profit dollars decreased 1.0 percent in
2000 from 1999, following an increase of 8.5 percent in 1999
from 1998. The decline in gross profit dollars in 2000 was
primarily because of lower revenue, higher costs for pur-
chased vendor software and higher vendor royalty payments,
partially offset by lower amortization and services costs.
Increased revenue and lower amortization costs associated
with previously capitalized software development spending
drove the 1999 improvement, partially offset by higher vendor
royalty payments primarily due to increased volumes.
management discussion
international business machines corporation
and Subsidiary Companies
page no.
fifty-five