IBM 2000 Annual Report Download - page 58
Download and view the complete annual report
Please find page 58 of the 2000 IBM annual report below. You can navigate through the pages in the report by either clicking on the pages listed below, or by using the keyword search tool below to find specific information within the annual report.-
 1
1 -
2
-
3
-
4
-
5
-
6
-
7
-
8
-
9
-
10
-
11
-
12
-
13
-
14
-
15
-
16
-
17
-
18
-
19
-
20
-
21
-
22
-
23
-
24
-
25
-
26
-
27
-
28
-
29
-
30
-
31
-
32
-
33
-
34
-
35
-
36
-
37
-
38
-
39
-
40
-
41
-
42
-
43
-
44
-
45
-
46
-
47
-
 48
48 -
 49
49 -
 50
50 -
 51
51 -
 52
52 -
 53
53 -
 54
54 -
 55
55 -
 56
56 -
 57
57 -
 58
58 -
 59
59 -
 60
60 -
 61
61 -
 62
62 -
 63
63 -
 64
64 -
 65
65 -
 66
66 -
 67
67 -
 68
68 -
69
-
70
-
71
-
72
-
73
-
74
-
75
-
76
-
77
-
78
-
79
-
80
-
81
-
82
-
83
-
84
-
85
-
86
-
87
-
88
-
89
-
90
-
91
-
92
-
93
-
94
-
95
-
96
-
97
-
98
-
99
-
100
 |
 |

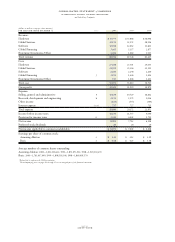
Global Financing
(dollars in millions) 2000 1999 1998
Revenue $«3,465 $«3,137 $«2,877
Cost 1,595 1,446 1,494
Gross profit $«1,870 $«1,691 $«1,383
Gross profit margin 54.0% 53.9% 48.1%
Global Financing revenue increased 10.4 percent (13 percent
at constant currency) in 2000 from 1999, following an increase
of 9.0 percent (10 percent at constant currency) in 1999 versus
1998. Growth in sales of used equipment and in commercial
financing drove the revenue increase in 2000. The revenue
increase in 1999 over 1998 was due to growth in commercial
financing and in financing of software and services.
Gross profit dollars increased 10.6 percent in 2000 versus
1999, following an increase of 22.3 percent in 1999 over
1998. The increase in 2000 was primarily driven by higher
sales of used equipment and an improving gross profit margin
on these sales. The increase in 1999, as well as in 2000,
reflects the company’s ongoing strategy to increase its use of
the Global Treasury Centers rather than have the Global
Financing business directly access external funding sources.
This strategy minimizes the company’s overall cost of bor-
rowing via an efficient and economical centralized funding
strategy that enables the company to access the global capital
markets. This results in a shift of some costs within the
Consolidated Statement of Earnings from Cost of Global
Financing to Interest expense. (See the Debt/Equity section
of the Management Discussion on page 60 for additional
discussion of Global Financing debt and note J,
“Borrowings,” on page 75 for additional discussion of the
company’s interest expense.)
Enterprise Investments/Other
(dollars in millions) 2000 1999*1998*
Revenue $«1,404 $«1,689 $«1,915
Cost 747 1,038 1,263
Gross profit $««««657 $««««651 $««««652
Gross profit margin 46.8% 38.5% 34.0%
*Reclassified to conform with 2000 presentation.
Enterprise Investments/Other revenue decreased 16.9 per-
cent (13 percent at constant currency) from 1999, following
a decrease of 11.8 percent (12 percent at constant currency)
in 1999 from 1998. The decrease in both years was driven
by lower revenue associated with the company’s decision in
1999 to discontinue certain product lines, such as auto-
mated teller machines (ATMs), partially offset by growth in
computer-aided three-dimensional interactive application
(CATIA) software.
The gross profit dollars from Enterprise Investments/
Other increased 0.9 percent in 2000 versus 1999, and were
flat in 1999 versus 1998. The increase in 2000 gross profit
dollars and gross profit margin was primarily due to a shift
in the mix of revenue to software products that have a higher
gross profit margin than the hardware product lines the
company discontinued in 1999.
Expenses
(dollars in millions) 2000 1999 1998
Selling, general and
administrative $«15,639 $«14,729 $«16,662
Percentage of revenue 17.7% 16.8% 20.4%
Research, development
and engineering $«««5,151 $«««5,273 $«««5,046
Percentage of revenue 5.8% 6.0% 6.2%
Selling, general and administrative (SG&A) expense increased
6.2 percent in 2000 versus 1999, following a decline of
11.6 percent in 1999 compared with 1998. The increase in
2000 was primarily driven by the 1999 net pre-tax benefit of
$2,107 million associated with the sale of the Global
Network, actions taken by the company in 1999 to improve
its competitiveness and to strengthen the company’s over-
all business portfolio, and implementation of a change
in personal computers’ depreciable lives. (See note D,
“Acquisitions/Divestitures,” on pages 72 through 74, and
note Q, “1999 Actions,” on pages 81 and 82 for further
information.) Excluding the 1999 actions and sale of the
Global Network, 2000 SG&A expense would have declined
7.1 percent versus 1999 and increased 1.0 percent in 1999
compared with 1998. In addition, its percentage of revenue
would have been 17.7 percent for 2000, 19.2 percent for
1999 and 20.4 percent for 1998.
This improved expense-to-revenue ratio in 2000 results
from the company’s aggressive management of its infrastruc-
ture expense and discretionary spending, and improvements
in its productivity through the use of technology and other
productivity tools. Examples include revenue generation and
customer services capabilities of ibm.com and a significant
increase in electronic processing within the procurement
function. The company also continues to benefit from growth
in its licensing of intellectual property. In addition, the
company has lower expenses as a result of the sale of the
Global Network and actions taken in 1999 to exit such
businesses as networking hardware and DRAM (dynamic
random access memory) manufacturing. SG&A expense also
benefited from the effects of currency and asset sales, exclud-
ing securities, in 2000.
management discussion
international business machines corporation
and Subsidiary Companies
page no.
fifty-six