IBM 2000 Annual Report Download - page 85
Download and view the complete annual report
Please find page 85 of the 2000 IBM annual report below. You can navigate through the pages in the report by either clicking on the pages listed below, or by using the keyword search tool below to find specific information within the annual report.-
 1
1 -
2
-
3
-
4
-
5
-
6
-
7
-
8
-
9
-
10
-
11
-
12
-
13
-
14
-
15
-
16
-
17
-
18
-
19
-
20
-
21
-
22
-
23
-
24
-
25
-
26
-
27
-
28
-
29
-
30
-
31
-
32
-
33
-
34
-
35
-
36
-
37
-
38
-
39
-
40
-
41
-
42
-
43
-
44
-
45
-
46
-
47
-
48
-
49
-
50
-
51
-
52
-
53
-
54
-
55
-
56
-
57
-
58
-
59
-
60
-
61
-
62
-
63
-
64
-
65
-
66
-
67
-
68
-
69
-
70
-
71
-
72
-
73
-
74
-
 75
75 -
 76
76 -
 77
77 -
 78
78 -
 79
79 -
 80
80 -
 81
81 -
 82
82 -
 83
83 -
 84
84 -
 85
85 -
 86
86 -
 87
87 -
 88
88 -
 89
89 -
 90
90 -
 91
91 -
 92
92 -
 93
93 -
 94
94 -
 95
95 -
96
-
97
-
98
-
99
-
100
 |
 |

page no.
eighty-three
notes to consolidated financial statements
international business machines corporation
and Subsidiary Companies
Stock options to purchase 34,633,343 common shares in
2000, 27,355,056 common shares in 1999 and 4,124,730
common shares in 1998 were outstanding, but were not
included in the computation of diluted earnings per share
because the exercise price of the options was greater than the
average market price of the common shares and, therefore,
the effect would have been antidilutive. In addition, 5,131,038
restricted stock units in 1998 relating to the company’s
Long-Term Performance Plan were not included in the
computation of diluted earnings per share as their effect
would have been antidilutive. Net income applicable to
common stockholders excludes preferred stock dividends of
$20 million for 2000, 1999 and 1998.
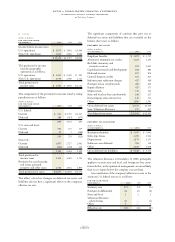
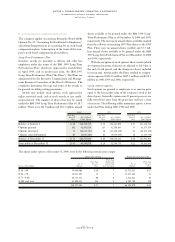
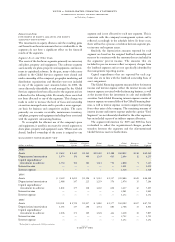
TRENTAL EXPENSE AND LEASE COMMITMENTS
Rental expense, including amounts charged to inventories and
fixed assets and excluding amounts previously reserved, was
$1,366 million in 2000, $1,397 million in 1999 and $1,431 mil-
lion in 1998. The table below depicts gross minimum rental
commitments under noncancelable leases, amounts related to
vacant space associated with infrastructure reduction and
restructuring actions taken through 1993 (previously
reserved), and sublease income commitments. These amounts
generally reflect activities related to office space and manufac-
turing equipment.
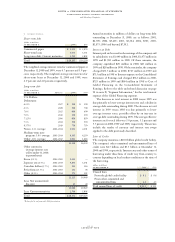
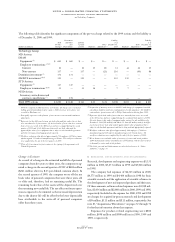
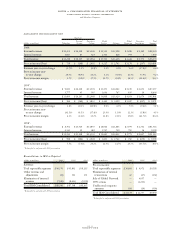
SEARNINGS PER SHARE OF COMMON STOCK
The following table sets forth the computation of basic and diluted earnings per share of common stock.
FOR THE YEAR ENDED DECEMBER 31: 2000 1999 1998
Weighted-average number of shares on which earnings per share
calculations are based:
Basic 1,763,037,049 1,808,538,346 1,869,005,570
Add
—
incremental shares under stock compensation plans 46,750,030 59,344,849 51,124,900
Add
—
incremental shares associated with contingently issuable shares 2,331,343 3,190,717 —
Assuming dilution 1,812,118,422 1,871,073,912 1,920,130,470
Net income applicable to common stockholders (millions) $«8,073 $«7,692 $«6,308
Less
—
net income applicable to contingently issuable shares (millions) 21 (11) —
Net income on which diluted earnings per share is calculated (millions) $«8,052 $«7,703 $«6,308
Earnings per share of common stock:
Assuming dilution $«««4.44 $«««4.12 $«««3.29
Basic $«««4.58 $«««4.25 $«««3.38
Beyond
(dollars in millions) 2001 2002 2003 2004 2005 2005
Gross rental commitments $«1,363 $«1,210 $«962 $«650 $«491 $«1,586
Vacant space 166 119 71 39 33 83
Sublease income commitments 100 75 53 40 36 19