IBM 2000 Annual Report Download - page 54
Download and view the complete annual report
Please find page 54 of the 2000 IBM annual report below. You can navigate through the pages in the report by either clicking on the pages listed below, or by using the keyword search tool below to find specific information within the annual report.-
 1
1 -
2
-
3
-
4
-
5
-
6
-
7
-
8
-
9
-
10
-
11
-
12
-
13
-
14
-
15
-
16
-
17
-
18
-
19
-
20
-
21
-
22
-
23
-
24
-
25
-
26
-
27
-
28
-
29
-
30
-
31
-
32
-
33
-
34
-
35
-
36
-
37
-
38
-
39
-
40
-
41
-
42
-
43
-
 44
44 -
 45
45 -
 46
46 -
 47
47 -
 48
48 -
 49
49 -
 50
50 -
 51
51 -
 52
52 -
 53
53 -
 54
54 -
 55
55 -
 56
56 -
 57
57 -
 58
58 -
 59
59 -
 60
60 -
 61
61 -
 62
62 -
 63
63 -
 64
64 -
65
-
66
-
67
-
68
-
69
-
70
-
71
-
72
-
73
-
74
-
75
-
76
-
77
-
78
-
79
-
80
-
81
-
82
-
83
-
84
-
85
-
86
-
87
-
88
-
89
-
90
-
91
-
92
-
93
-
94
-
95
-
96
-
97
-
98
-
99
-
100
 |
 |

page no.
fifty-two
management discussion
international business machines corporation
and Subsidiary Companies
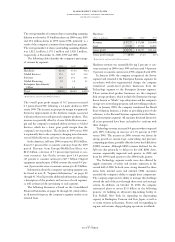
OVERVIEW OF 2000
IBM finished the year 2000 with a strong fourth quarter
performance after three challenging quarters. The company’s
revenue, net income and earnings per share again reached
record levels and cash flow was strong. In many respects, the
full-year financial performance reflects momentum that had
been building steadily all year, momentum that is an affirma-
tion of the strategies adopted over the last several years : a
focus on services and solutions; powerful, scalable servers;
and open-source platforms. The company also had solid
full-year results in the strategic high-growth areas of serv-
ices, middleware software and technology. In addition,
Global Services ended the year with a strong backlog of
services contracts totaling $85 billion, up from $60 billion
at year-end 1999.
The company reported revenue of $88.4 billion, net
income of $8.1 billion and $4.44 diluted earnings per common
share. The effects of adverse currency movements lowered
year-to-year revenue growth from approximately 4 percent
at constant currency to 1 percent on an as reported basis. In
Europe/Middle East/Africa, revenue declined 5 percent (up
6 percent at constant currency). Asia Pacific revenue grew
16 percent (15 percent at constant currency). In the Americas,
revenue decreased 0.5 percent (flat at constant currency).
In 2000, aggressive focus on cost and expense manage-
ment improved the company’s gross profit margin (despite a
changing mix of business) and net income margin. The
company continued to use technology and other productivity
improvements to enhance the efficiency of its operations,
particularly by increasing the revenue generation and customer
service capabilities of ibm.com and significantly increasing
electronic processing within the procurement function.
The company ended 2000 with cash and cash equivalents
and current marketable securities of $3.7 billion, after
funding investments of over $18 billion in capital expendi-
tures; research, development and engineering; strategic
acquisitions; and repurchases of common stock. During
2000, the company announced a multi-year, $5 billion pro-
gram to build an advanced chip-making facility and to
expand operations at its worldwide technology facilities.
Share repurchases resulted in common shares outstanding at
year-end 2000 of 1.74 billion, down 2 percent compared
with 1.78 billion last year. During 2000, the company’s non-
global financing related debt was reduced while Global
Financing debt increased in line with the asset growth of the
Global Financing business.
CHALLENGES
The company’s broad portfolio and geographic diversification
position it well relative to its competitors in 2001. The com-
pany’s top priority is to build on the momentum of last year,
driven, for the most part, by business strategies taking hold;
the marketplace moving in the company’s direction; demand
increasing for IBM’s products and services (particularly
e-business applications and services); and the company’s
improved execution.
In 2001, the company faces concerns that economic soft-
ness in the United States could worsen and expand into
non-U.S. markets. Increasingly aggressive price competition
and the potential effects of ongoing adverse currency move-
ments are other areas of volatility.
Yet, even against a backdrop of uncertainty, the company
is in a unique competitive position. Its traditional customer
base
—
essentially large, global institutions
—
requires the
technology and services of the company to improve compet-
itiveness, in both good times and bad. The company’s ability
to integrate complex technologies across the full range of
computing platforms sets it apart from competitors.
FORWARD-LOOKING AND CAUTIONARY STATEMENTS
Certain statements contained in this Annual Report may
constitute forward-looking statements within the meaning
of the Private Securities Litigation Reform Act of 1995.
These statements involve a number of risks, uncertainties and
other factors that could cause actual results to be materially
different, as discussed more fully elsewhere in this Annual
Report and in the company’s filings with the Securities and
Exchange Commission, including the company’s 2000 Form
10-Kto be filed on or about March 12, 2001.
RESULTS OF OPERATIONS
(dollars in millions
except per share amounts) 2000 1999 1998
Revenue $«88,396 $«87,548 $«81,667
Cost 55,972 55,619 50,795
Gross profit 32,424 31,929 30,872
Gross profit margin 36.7% 36.4% 37.8%
Total expense 20,890 20,172 21,832
Income before
income taxes $«11,534 $«11,757 $«««9,040
Net income $«««8,093 $«÷7,712 $«««6,328
Earnings per share
of common stock:
Assuming dilution $«««««4.44 $÷÷«4.12 $«««««3.29
Basic $«««««4.58 $÷÷«4.25 $÷÷«3.38