IBM 2000 Annual Report Download - page 60
Download and view the complete annual report
Please find page 60 of the 2000 IBM annual report below. You can navigate through the pages in the report by either clicking on the pages listed below, or by using the keyword search tool below to find specific information within the annual report.-
 1
1 -
2
-
3
-
4
-
5
-
6
-
7
-
8
-
9
-
10
-
11
-
12
-
13
-
14
-
15
-
16
-
17
-
18
-
19
-
20
-
21
-
22
-
23
-
24
-
25
-
26
-
27
-
28
-
29
-
30
-
31
-
32
-
33
-
34
-
35
-
36
-
37
-
38
-
39
-
40
-
41
-
42
-
43
-
44
-
45
-
46
-
47
-
48
-
49
-
 50
50 -
 51
51 -
 52
52 -
 53
53 -
 54
54 -
 55
55 -
 56
56 -
 57
57 -
 58
58 -
 59
59 -
 60
60 -
 61
61 -
 62
62 -
 63
63 -
 64
64 -
 65
65 -
 66
66 -
 67
67 -
 68
68 -
 69
69 -
 70
70 -
71
-
72
-
73
-
74
-
75
-
76
-
77
-
78
-
79
-
80
-
81
-
82
-
83
-
84
-
85
-
86
-
87
-
88
-
89
-
90
-
91
-
92
-
93
-
94
-
95
-
96
-
97
-
98
-
99
-
100
 |
 |

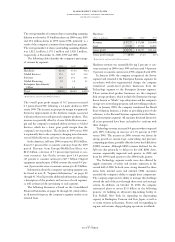
FOURTH QUARTER
The company’s fourth-quarter results reflect the momentum
that has been building steadily all year. For the quarter
ended December 31, 2000, the company had revenue of
$25.6 billion, an increase of 5.9 percent (12 percent at con-
stant currency) compared with the fourth quarter of 1999.
Fourth quarter 2000 net income was $2.7 billion ($1.48 per
diluted common share), compared with net income of $2.1
billion ($1.12 per diluted common share) in the fourth
quarter of 1999.
In the Americas, fourth-quarter revenue was $10.8 billion,
an increase of 3.3 percent (4 percent at constant currency)
from the 1999 period. Revenue from Europe/Middle East/
Africa was $7.4 billion, up 3.0 percent (18 percent at constant
currency). Asia Pacific revenue increased 13.3 percent (20
percent at constant currency) to $5.0 billion. OEM revenue
increased 13.4 percent (14 percent at constant currency) to
$2.4 billion compared with the fourth quarter of 1999.
Hardware revenue increased 9.7 percent (15 percent at
constant currency) to $11.4 billion from the fourth quarter
of 1999, with revenue growth across all server, storage and
technology hardware categories. The company began ship-
ping its new z900 server in mid-December, contributing to a
greater than 100 percent increase in shipments of mainframe
computing capacity in the fourth quarter, as measured in
MIPS. Revenue grew strongly for the pSeries UNIX servers,
with particular strength in the mid-range and high-end Web
server models. Revenues for the mid-range iSeries servers
also increased, with growth across all geographic areas.
Personal Systems revenue grew significantly and the unit
was profitable in the quarter. Microelectronics revenue also
increased strongly, principally due to continued acceleration
in growth of sophisticated, leading-edge custom chips.
Revenue for HDDs increased as well. Excluding networking
products, storage revenue increased, driven by Shark and
shipment of its advanced functions.
Revenue from Global Services, including maintenance,
grew 5.2 percent (12 percent at constant currency) in the
fourth quarter to $9.2 billion, reflecting revenue growth
across all services categories. e-business services revenue grew
more than 70 percent year over year. Revenue comparisons
for Global Services were adversely affected by a year-over-
year decline in the Y2Kservices business and the sale of the
Global Network in 1999. After adjusting for these factors,
Global Services revenue (excluding maintenance) increased
10.1 percent (17 percent at constant currency). The com-
pany signed more than $12.5 billion in services contracts in
the quarter.
Software revenue totaled $3.6 billion, decreasing 1.0 per-
cent (up 6 percent at constant currency) versus the fourth
quarter of 1999. Revenues continued to grow strongly in the
company’s middleware segment, with significant growth in
database and Web-management software. Tivoli revenues
declined in the quarter, reflecting an ongoing transition in
this product area.
Global Financing revenue increased 6.2 percent (10 per-
cent at constant currency) in the fourth quarter to $1.0 billion,
primarily as a result of increased sales of used equipment.
Revenue from the Enterprise Investments/Other area,
which includes custom hardware and software products for
specialized customer uses, declined 10.7 percent (3 percent
at constant currency) year over year to $425 million.
The company’s total gross profit margin was 37.7 percent
in the fourth quarter of 2000 compared with 36.7 percent in
the fourth quarter of 1999. The increase was driven by a 3.5
point improvement in the hardware gross profit margin as
eServer, personal computer and HDD gross profit margins
improved year over year. In addition, the Global Financing
gross profit margin increased 6.1 points, primarily as a result
of higher margins for hardware remarketing. These
increases were partially offset by a decline in the Global
Services gross profit margin of 0.9 points. This decline was
primarily driven by lower Business Innovation Services
revenue, which benefited from Y2Kservices in 1999, par-
tially offset by an improvement in the Strategic Outsourcing
Services gross profit margin.
Total fourth-quarter 2000 expense declined 0.3 percent
when compared with the fourth quarter of 1999. SG&A
expense decreased 2.4 percent, primarily driven by the
effects of currency, while RD&E expense increased 2.4 per-
cent year over year. The expense-to-revenue ratio in the
fourth quarter of 2000 was 23.0 percent, compared with 24.4
percent in 1999.
The company’s tax rate was 29.5 percent in the fourth
quarter, down slightly as compared with 30.0 percent in the
fourth quarter of last year.
The company spent approximately $1.4 billion on common
share repurchases in the fourth quarter. The average number
of common shares outstanding assuming dilution was lower
by 57.2 million shares in fourth quarter 2000 versus fourth
quarter 1999, primarily as a result of these repurchases. The
average number of shares assuming dilution was 1,790.6 mil-
lion in fourth quarter 2000 versus 1,847.8 million in fourth
quarter 1999.
management discussion
international business machines corporation
and Subsidiary Companies
page no.
fifty-eight