IBM 2000 Annual Report Download - page 64
Download and view the complete annual report
Please find page 64 of the 2000 IBM annual report below. You can navigate through the pages in the report by either clicking on the pages listed below, or by using the keyword search tool below to find specific information within the annual report.-
 1
1 -
2
-
3
-
4
-
5
-
6
-
7
-
8
-
9
-
10
-
11
-
12
-
13
-
14
-
15
-
16
-
17
-
18
-
19
-
20
-
21
-
22
-
23
-
24
-
25
-
26
-
27
-
28
-
29
-
30
-
31
-
32
-
33
-
34
-
35
-
36
-
37
-
38
-
39
-
40
-
41
-
42
-
43
-
44
-
45
-
46
-
47
-
48
-
49
-
50
-
51
-
52
-
53
-
 54
54 -
 55
55 -
 56
56 -
 57
57 -
 58
58 -
 59
59 -
 60
60 -
 61
61 -
 62
62 -
 63
63 -
 64
64 -
 65
65 -
 66
66 -
 67
67 -
 68
68 -
 69
69 -
 70
70 -
 71
71 -
 72
72 -
 73
73 -
 74
74 -
75
-
76
-
77
-
78
-
79
-
80
-
81
-
82
-
83
-
84
-
85
-
86
-
87
-
88
-
89
-
90
-
91
-
92
-
93
-
94
-
95
-
96
-
97
-
98
-
99
-
100
 |
 |

Information provided by the sensitivity analysis does not
necessarily represent the actual changes in fair value that the
company would incur under normal market conditions
because, due to practical limitations, all variables other than
the specific market risk factor are held constant. In addition,
the results of the model are constrained by the fact that
certain items are specifically excluded from the analysis,
while the financial instruments that relate to the financing or
hedging of those items are included by definition. Excluded
items include leased assets, forecasted foreign currency cash
flows, and the company’s net investment in foreign opera-
tions. As a consequence, the reported changes in the values
of some financial instruments that affect the results of the
sensitivity analysis are not matched with the offsetting
changes in the values of the items that those instruments are
designed to finance or hedge.
The results of the sensitivity analysis at December 31,
2000, and December 31, 1999, are as follows:
INTEREST RATE RISK
As of December 31, 2000, a 10 percent decrease in the levels
of interest rates with all other variables held constant would
result in a decrease in the fair value of the company’s financial
instruments of $99 million as compared with a decrease of
$164 million as of December 31, 1999. A 10 percent increase
in the levels of interest rates with all other variables held
constant would result in an increase in the fair value of
the company’s financial instruments of $83 million as of
December 31, 2000, as compared with an increase of $145
million as of December 31, 1999. Changes in the relative sen-
sitivity of the fair value of the company’s financial instrument
portfolio for these theoretical changes in the level of interest
rates primarily are driven by changes in the company’s debt
maturity and interest rate profile and amount. In 2000 versus
1999, the reported decline in interest rate sensitivity primarily
is due to adjustments in the company’s “receive fixed/pay
floating” interest rate swap portfolio to more closely match
the maturity profile of the company’s fixed rate debt.
FOREIGN CURRENCY EXCHANGE RATE RISK
As of December 31, 2000, a 10 percent decrease or increase
in the levels of foreign currency exchange rates against the
U.S. dollar with all other variables held constant would
result in a decrease in the fair value of the company’s
financial instruments of $1,352 million or an increase in the
fair value of the company’s financial instruments of $1,435
million, respectively, compared with a decrease of $1,319
million or an increase of $1,340 million, respectively, as of
December 31, 1999. The change in the relative sensitivity of
the fair value of the company’s financial instrument portfolio
to the level of foreign currency exchange rates was primarily
driven by increased hedging activity of foreign currency
transactions in accordance with the company’s established risk
management practices. As the effect of offsetting changes in
the fair market value of the company’s anticipated foreign
currency cash flows are not included in the sensitivity model,
the results of the analysis are not indicative of an increase in
the company’s actual exposure to foreign currency exchange
rate risk.
Financing Risks
Global Financing is an integral part of the company’s total
worldwide offerings. Inherent in Global Financing are
certain risks, including credit, interest rate, currency and
residual value. The company manages credit risk through
comprehensive credit evaluations and pricing practices. To
manage the risks associated with an uncertain interest rate
environment, the company pursues a funding strategy of
substantially matching the interest rate profile of its debt
with the interest rate profile of its assets. Currency risks are
managed by denominating liabilities in the same currency
as the assets.
Residual value risk is managed by developing projections
of future equipment values at lease inception, reevaluating
these projections periodically, and effectively deploying
remarketing capabilities to recover residual values and
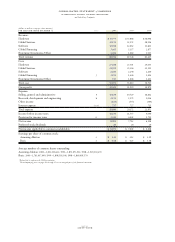
potentially earn a profit. The following table presents the
recorded amount of unguaranteed residual values for sales-
type and operating leases as of December 31, 1998, 1999 and
2000. In addition, the table presents the run out of the
unguaranteed residual value over the remaining lives of
these leases as of December 31, 2000. The following table
excludes approximately $34 million of estimated residual
value associated with non-information technology equip-
ment. There was no significant change in the ratio of the
unguaranteed residual value to total net investment in sales-
type leases from December 31, 1999 to December 31, 2000.
management discussion
international business machines corporation
and Subsidiary Companies
page no.
sixty-two
Total Run out of 2000 Balance
2004 and
(dollars in millions) 1998 1999 2000 2001 2002 2003 beyond
Sales-type leases $««««685 $««««737 $÷÷751 $«275 $«273 $«174 $«29
Operating leases 731 609 396 230 124 37 5
Total residual value $«1,416 $«1,346 $«1,147 $«505 $«397 $«211 $«34