IBM 2000 Annual Report Download - page 90
Download and view the complete annual report
Please find page 90 of the 2000 IBM annual report below. You can navigate through the pages in the report by either clicking on the pages listed below, or by using the keyword search tool below to find specific information within the annual report.-
 1
1 -
2
-
3
-
4
-
5
-
6
-
7
-
8
-
9
-
10
-
11
-
12
-
13
-
14
-
15
-
16
-
17
-
18
-
19
-
20
-
21
-
22
-
23
-
24
-
25
-
26
-
27
-
28
-
29
-
30
-
31
-
32
-
33
-
34
-
35
-
36
-
37
-
38
-
39
-
40
-
41
-
42
-
43
-
44
-
45
-
46
-
47
-
48
-
49
-
50
-
51
-
52
-
53
-
54
-
55
-
56
-
57
-
58
-
59
-
60
-
61
-
62
-
63
-
64
-
65
-
66
-
67
-
68
-
69
-
70
-
71
-
72
-
73
-
74
-
75
-
76
-
77
-
78
-
79
-
 80
80 -
 81
81 -
 82
82 -
 83
83 -
 84
84 -
 85
85 -
 86
86 -
 87
87 -
 88
88 -
 89
89 -
 90
90 -
 91
91 -
 92
92 -
 93
93 -
 94
94 -
 95
95 -
 96
96 -
 97
97 -
 98
98 -
 99
99 -
 100
100
 |
 |

page no.
eighty-eight
notes to consolidated financial statements
international business machines corporation
and Subsidiary Companies
time to time, the company contributes additional amounts as
it deems appropriate. Liabilities for amounts in excess of
these funding levels are accrued and reported in the company’s
Consolidated Statement of Financial Position. The assets of
the various plans include corporate equities, government
securities, corporate debt securities and real estate.
Other
At December 31, 2000, the material non-U.S. defined bene-
fit plans in which the fair value of plan assets exceeded the
benefit obligation had obligations of $16,941 million and
assets of $20,915 million. The material non-U.S. defined
benefit plans in which the benefit obligation exceeded the
fair value of plan assets had obligations of $4,209 million and
assets of $3,919 million.
At December 31, 1999, the material non-U.S. defined
benefit plans in which the fair value of plan assets exceeded
the benefit obligation had obligations of $21,168 million and
assets of $27,400 million. The material non-U.S. defined
benefit plans in which the benefit obligation exceeded the
fair value of plan assets had obligations of $602 million and
assets of $443 million.
The change from 1999 to 2000 was the result of the
company’s pension plan in Japan. In 1999, the Japan pension
plan assets exceeded its benefit obligation by approximately
15 percent. In 2000, the benefit obligation exceeded assets
by approximately 3 percent. Total assets of this plan at
December 31, 2000 exceeded $3,500 million.
WNONPENSION POSTRETIREMENT BENEFITS
The total (income)/cost of the company’s nonpension post-
retirement benefits for the years ended December 31, 2000,
1999 and 1998 were $401 million, $371 million and $375
million, respectively. The company has a defined benefit
postretirement plan that provides medical, dental and life
insurance for U.S. retirees and eligible dependents. The total
net (income)/cost of this plan for the years ended December
31, 2000, 1999 and 1998, was $374 million, $342 million and
$331 million, respectively. Effective July 1, 1999, the com-
pany established a “Future Health Account (FHA) Plan” for
employees who are more than five years away from retirement
eligibility. Employees who can retire within five years retain
the benefits under the company’s preexisting retiree health
benefits plan. Under either the FHA or the preexisting plan,
there is a maximum cost to the company for retiree health
care. For employees who retired before January 1, 1992, that
maximum will become effective in the year 2001. For all
other employees, the maximum is effective on retirement.
Certain of the company’s non-U.S. subsidiaries have sim-
ilar plans for retirees. However, most of the retirees outside
the United States are covered by government-sponsored and
administered programs. The total net (income)/cost of these
plans for the years ended December 31, 2000, 1999 and 1998
was $27 million, $29 million and $44 million, respectively.
At December 31, 2000 and 1999, Other liabilities on the
Consolidated Statement of Financial Position include non-
U.S. postretirement benefit liabilities of $208 million and
$219 million, respectively.
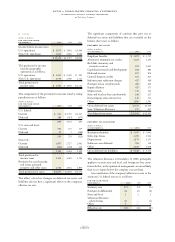
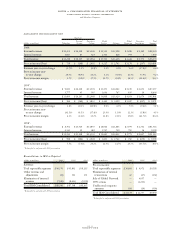
The net periodic postretirement benefit cost for the U.S.
plan for the years ended December 31 include the following
components:
(dollars in millions) 2000 1999 1998
Service cost $«««50 $«««48 $«««42
Interest cost 449 424 427
Expected return on
plan assets (2) (6) (5)
Amortization of
prior service costs (147) (143) (133)
Recognized actuarial losses 24 19 —
Net periodic post-
retirement benefit cost $«374 $«342 $«331
The changes in the benefit obligation and plan assets of the
U.S. plan for 2000 and 1999 are as follows:
(dollars in millions) 2000 1999
Change in benefit obligation:
Benefit obligation at beginning of year $««6,178 $««6,457
Service cost 50 48
Interest cost 449 424
Amendments — (127)
Actuarial gains (69) (445)
Actuarial losses 432 371
Benefits paid from trust (87) (325)
Direct benefit payments (510) (225)
Benefit obligation at end of year 6,443 6,178
Change in plan assets:
Fair value of plan assets at
beginning of year 105 123
Actual loss on plan assets (14) (18)
Employer contributions — 325
Benefits paid, net of employee
contributions (87) (325)
Fair value of plan assets at end of year 4 105
Benefit obligation in excess
of plan assets (6,439) (6,073)
Unrecognized net actuarial losses 986 631
Unrecognized prior service costs (801) (948)
Accrued postretirement benefit
liability recognized in the
Consolidated Statement
of Financial Position $«(6,254) $«(6,390)
The plan assets primarily comprise short-term fixed income
investments.