IBM 2000 Annual Report Download - page 78
Download and view the complete annual report
Please find page 78 of the 2000 IBM annual report below. You can navigate through the pages in the report by either clicking on the pages listed below, or by using the keyword search tool below to find specific information within the annual report.-
 1
1 -
2
-
3
-
4
-
5
-
6
-
7
-
8
-
9
-
10
-
11
-
12
-
13
-
14
-
15
-
16
-
17
-
18
-
19
-
20
-
21
-
22
-
23
-
24
-
25
-
26
-
27
-
28
-
29
-
30
-
31
-
32
-
33
-
34
-
35
-
36
-
37
-
38
-
39
-
40
-
41
-
42
-
43
-
44
-
45
-
46
-
47
-
48
-
49
-
50
-
51
-
52
-
53
-
54
-
55
-
56
-
57
-
58
-
59
-
60
-
61
-
62
-
63
-
64
-
65
-
66
-
67
-
 68
68 -
 69
69 -
 70
70 -
 71
71 -
 72
72 -
 73
73 -
 74
74 -
 75
75 -
 76
76 -
 77
77 -
 78
78 -
 79
79 -
 80
80 -
 81
81 -
 82
82 -
 83
83 -
 84
84 -
 85
85 -
 86
86 -
 87
87 -
 88
88 -
89
-
90
-
91
-
92
-
93
-
94
-
95
-
96
-
97
-
98
-
99
-
100
 |
 |

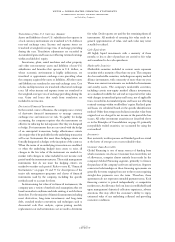
KFINANCIAL INSTRUMENTS
The company maintains on- and off-balance sheet portfolios
of financial instruments.
Financial Instruments On-Balance Sheet
(excluding derivatives)
Cash and cash equivalents, marketable securities, notes and
other accounts receivable and other investments are financial
assets with carrying values that approximate fair value.
Accounts payable, other accrued expenses and liabilities, and
short-term and long-term debt are financial liabilities with
carrying values that approximate fair value.
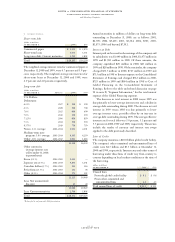
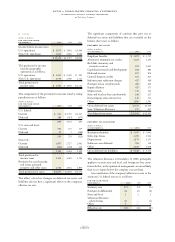
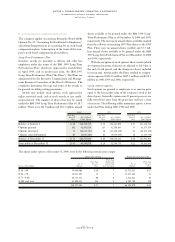
The following table summarizes the company’s marketable
securities, all of which are considered available for sale, and
alliance investments.
MARKETABLE SECURITIES*
(dollars in millions) Fair Value
AT DECEMBER 31: 2000 1999
Current marketable securities:
U.S. government securities $««««««— $÷÷÷15
Time deposits and other obligations 153 746
Non-U.S. government securities and
other fixed-term obligations 627
Total $««««159 $««««788
Marketable securities
—
non-current:**
Time deposits and other obligations $««««163 $÷÷105
Non-U.S. government securities and
other fixed-term obligations 88
Total $««««171 $÷÷113
Non-equity method alliance
investments** $««««909 $«1,439
*Gross unrealized gains (before taxes) on marketable securities and alliance
investments were $47 million and $1,310 million at December 31, 2000 and
1999, respectively. Gross unrealized losses (before taxes) on marketable securities
and alliance investments were $175 million and $7 million at December 31,
2000 and 1999, respectively. See note M, “Stockholders’ Equity Activity,” on
page 79 for accumulated and net change in unrealized gains and losses
on marketable securities.
** Included within Investments and sundry assets on the Consolidated Statement of
Financial Position. (See note H, “Investments and Sundry Assets,” on page 74.)
Financial Instruments Off-Balance Sheet
(excluding derivatives)
The company has guaranteed certain loans and financial
commitments of its affiliates. The approximate amount of
these financial guarantees was $0.4 billion and $1.2 billion at
December 31, 2000 and 1999, respectively.
The company extended lines of credit, of which the
unused amounts were $4.2 billion and $4.5 billion at
December 31, 2000 and 1999, respectively. A portion of
these amounts was available to the company’s dealers to
support their working capital needs.
The company enters into contracts that effectively pro-
vide the company with committed future borrowings in
select foreign currencies. The aggregate amount of these
contracts was $9.0 billion and $6.4 billion at December 31,
2000 and 1999, respectively. The terms of these contracts
generally are less than eighteen months. Foreign exchange
gains and losses associated with these contracts are recorded
in net income as they are realized. These amounts have not
been and are not expected to be material to the company’s
financial results.
Derivatives and Hedging
The company operates in approximately 40 functional cur-
rencies and is a significant lender and a borrower in the
global financial markets. In the normal course of business,
the company is exposed to the impact of interest rate
changes and foreign currency fluctuations. The company
limits these risks by following established risk management
policies and procedures including the use of derivatives and,
where cost-effective, financing with debt in the currencies in
which assets are denominated. For interest rate exposures,
derivatives are primarily used to align rate movements
between interest rates associated with the company’s lease
and other financial assets and interest rates associated with
its financing debt and to manage the related cost of debt. For
currency exposures, derivatives are used to limit the effects
of foreign exchange rate fluctuations on financial results.
The company does not use derivatives for trading or
speculative purposes, nor is it a party to leveraged deriva-
tives. Further, the company has a policy of only entering into
contracts with carefully selected major financial institutions
based upon their credit ratings and other factors and main-
tains strict dollar and term limits that correspond to the
institution’s credit rating. The company’s current credit
exposure under these agreements is limited to the fair value
of instruments with a positive fair value at the reporting
date. When viewed in conjunction with the underlying and
offsetting exposure that the derivatives are designed to
hedge, the company has not sustained a material loss from
these instruments nor does it anticipate any material adverse
effect on its net income or financial position in the future
from the use of derivatives.
In its hedging programs, the company employs the use of
options, forwards, interest rate and currency swaps, caps,
floors or a combination thereof depending upon the under-
lying exposure.
notes to consolidated financial statements
international business machines corporation
and Subsidiary Companies
page no.
seventy-six