Honeywell 2002 Annual Report Download - page 278
Download and view the complete annual report
Please find page 278 of the 2002 Honeywell annual report below. You can navigate through the pages in the report by either clicking on the pages listed below, or by using the keyword search tool below to find specific information within the annual report.-
 1
1 -
2
-
3
-
4
-
5
-
6
-
7
-
8
-
9
-
10
-
11
-
12
-
13
-
14
-
15
-
16
-
17
-
18
-
19
-
20
-
21
-
22
-
23
-
24
-
25
-
26
-
27
-
28
-
29
-
30
-
31
-
32
-
33
-
34
-
35
-
36
-
37
-
38
-
39
-
40
-
41
-
42
-
43
-
44
-
45
-
46
-
47
-
48
-
49
-
50
-
51
-
52
-
53
-
54
-
55
-
56
-
57
-
58
-
59
-
60
-
61
-
62
-
63
-
64
-
65
-
66
-
67
-
68
-
69
-
70
-
71
-
72
-
73
-
74
-
75
-
76
-
77
-
78
-
79
-
80
-
81
-
82
-
83
-
84
-
85
-
86
-
87
-
88
-
89
-
90
-
91
-
92
-
93
-
94
-
95
-
96
-
97
-
98
-
99
-
100
-
101
-
102
-
103
-
104
-
105
-
106
-
107
-
108
-
109
-
110
-
111
-
112
-
113
-
114
-
115
-
116
-
117
-
118
-
119
-
120
-
121
-
122
-
123
-
124
-
125
-
126
-
127
-
128
-
129
-
130
-
131
-
132
-
133
-
134
-
135
-
136
-
137
-
138
-
139
-
140
-
141
-
142
-
143
-
144
-
145
-
146
-
147
-
148
-
149
-
150
-
151
-
152
-
153
-
154
-
155
-
156
-
157
-
158
-
159
-
160
-
161
-
162
-
163
-
164
-
165
-
166
-
167
-
168
-
169
-
170
-
171
-
172
-
173
-
174
-
175
-
176
-
177
-
178
-
179
-
180
-
181
-
182
-
183
-
184
-
185
-
186
-
187
-
188
-
189
-
190
-
191
-
192
-
193
-
194
-
195
-
196
-
197
-
198
-
199
-
200
-
201
-
202
-
203
-
204
-
205
-
206
-
207
-
208
-
209
-
210
-
211
-
212
-
213
-
214
-
215
-
216
-
217
-
218
-
219
-
220
-
221
-
222
-
223
-
224
-
225
-
226
-
227
-
228
-
229
-
230
-
231
-
232
-
233
-
234
-
235
-
236
-
237
-
238
-
239
-
240
-
241
-
242
-
243
-
244
-
245
-
246
-
247
-
248
-
249
-
250
-
251
-
252
-
253
-
254
-
255
-
256
-
257
-
258
-
259
-
260
-
261
-
262
-
263
-
264
-
265
-
266
-
267
-
 268
268 -
 269
269 -
 270
270 -
 271
271 -
 272
272 -
 273
273 -
 274
274 -
 275
275 -
 276
276 -
 277
277 -
 278
278 -
 279
279 -
 280
280 -
 281
281 -
 282
282 -
 283
283 -
 284
284 -
 285
285 -
 286
286 -
 287
287 -
 288
288 -
289
-
290
-
291
-
292
-
293
-
294
-
295
-
296
-
297
 |
 |
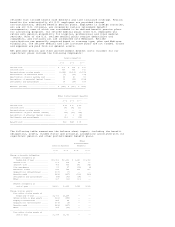
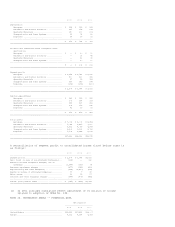
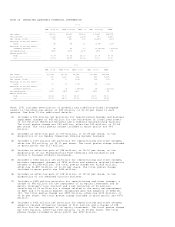
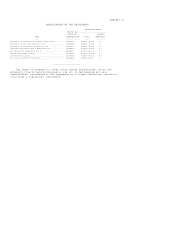
NOTE 25. UNAUDITED QUARTERLY FINANCIAL INFORMATION
2002
------------------------------------------------------------------
MAR. 31(1)(2) JUNE 30(3)(4) SEPT. 30 DEC. 31(5)(6) YEAR
------------------------------------------------------------------
Net sales .................... $5,199 $5,651 $5,569 $ 5,855 $22,274
Gross profit ................. 1,126 1,220 1,333 980 4,659
Net income (loss) ............ 376 459 412 (1,467) (220)
Earnings (loss) per share--
basic ..................... .46 .56 .50 (1.78) (.27)
Earnings (loss) per share--
assuming dilution ......... .46 .56 .50 (1.78)(11) (.27)(11)
Dividends paid ............... .1875 .1875 .1875 .1875 .75
Market price(12)
High ...................... 40.37 40.76 36.50 27.08 40.76
Low ....................... 29.11 34.85 21.66 19.20 19.20
====================================================================================================
2001
--------------------------------------------------------------
MAR. 31(7) JUNE 30(8) SEPT. 30(9) DEC. 31(10) YEAR
--------------------------------------------------------------
Net sales ..................... $5,944 $6,066 $5,789 $5,853 $23,652
Gross profit .................. 971 1,110 614 832 3,527
Net income (loss) ............. 41 50 (308) 118 (99)
Earnings (loss) per share--
basic ...................... .05 .06 (.38) .14 (.12)
Earnings (loss) per share--
assuming dilution .......... .05 .06 (.38)(11) .14 (.12)(11)
Dividends paid ................ .1875 .1875 .1875 .1875 .75
Market price(12)
High ....................... 49.42 53.50 38.95 34.50 53.50
Low ........................ 35.93 34.90 23.59 25.65 23.59
================================================================================================
Note: 2001 includes amortization of goodwill and indefinite-lived intangible
assets in the after-tax amount of $49 million, or $0.06 per share in each
quarter. See Note 13 for additional details.
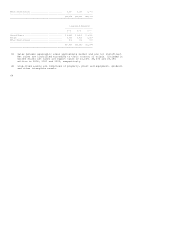
(1) Includes a $53 million net provision for repositioning charges and business
impairment charges of $43 million for the write-down of long-lived assets
of our Friction Materials business and a chemical manufacturing facility.
The total pretax charge was $96 million, after-tax $69 million, or $0.08
per share. The total pretax charge included in gross profit was $46
million.
(2) Includes an after-tax gain of $79 million, or $0.09 per share, on the
disposition of our Bendix Commercial Vehicle Systems business.
(3) Includes a $137 million net provision for repositioning and other charges,
after-tax $93 million, or $0.11 per share. The total pretax charge included
in gross profit was $127 million.
(4) Includes an after-tax gain of $98 million, or $0.12 per share, on the
dispositions of our Pharmaceutical Fine Chemicals and Automation and
Control's Consumer Products businesses.
(5) Includes a $444 million net provision for repositioning and other charges,
business impairment charges of $834 million and asbestos related litigation
charges of $1,548 million. The total pretax charge was $2,826 million,
after-tax $1,897 million, or $2.30 per share. The total pretax charge
included in gross profit was $444 million.
(6) Includes an after-tax gain of $18 million, or $0.02 per share, on the
disposition of our Advanced Circuits business.
(7) Includes a $495 million provision for repositioning and other charges, a
charge of $95 million for the impairment of an equity investment and an
equity investee's loss contract and a net provision of $5 million,
consisting of $6 million for a charge related to the early extinguishment
of debt and a $1 million benefit recognized upon the adoption of SFAS No.
133. The total pretax charge was $595 million, after-tax $374 million, or
$0.46 per share. The total pretax charge included in gross profit was $474
million.
(8) Includes a $462 million net provision for repositioning and other charges,
asbestos related litigation charges of $111 million and a charge of $78
million for the impairment of an equity investment. The total pretax charge
was $651 million, after-tax $400 million, or $0.49 per share. The total
pretax charge included in gross profit was $397 million.