Honeywell 2002 Annual Report Download - page 211
Download and view the complete annual report
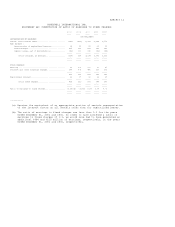
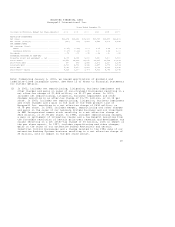
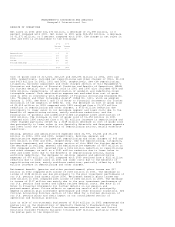
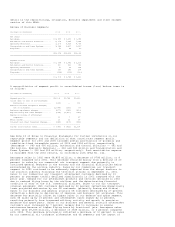
Please find page 211 of the 2002 Honeywell annual report below. You can navigate through the pages in the report by either clicking on the pages listed below, or by using the keyword search tool below to find specific information within the annual report.Automation and Control Solutions sales in 2002 were $6,978 million, a decrease
of $207 million, or 3 percent compared with 2001. Sales declined by 3 percent
for our Automation and Control Products business primarily due to the
disposition of our Consumer Products business and softness in capital spending
partially offset by increased demand for security-related products. Sales for
our Industry Solutions business declined by 4 percent resulting from ongoing
softness in industrial production and capital spending. Sales for our Service
business also decreased by 3 percent due primarily to general weakness in the
economy. Automation and Control Solutions sales in 2001 were $7,185 million, a
decrease of $199 million, or 3 percent compared with 2000. Excluding the impact
of foreign exchange, acquisitions and divestitures, sales decreased
approximately 2 percent. This decrease resulted primarily from lower sales for
our Automation and Control Products business primarily due to weakness in key
end-markets partially offset by higher sales for our security related products
due principally to our acquisition of Pittway in the prior year. Our Service
business also had lower sales due primarily to weakness in our security
monitoring business. This decrease was partially offset by higher sales for our
Industry Solutions business.
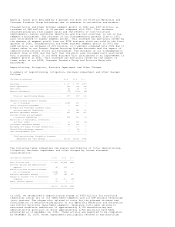
Automation and Control Solutions segment profit in 2002 was $890 million, an
increase of $71 million, or 9 percent compared with 2001. Excluding goodwill
amortization expense in 2001, segment profit in 2002 decreased by 2 percent
compared with 2001. This decrease resulted primarily from the impact of lower
sales volumes and pricing pressures, mainly in our Automation and Control
Products and Service businesses. This decrease was partially offset by lower
costs due to the benefits of repositioning actions, mainly workforce reductions.
Automation and Control Solutions segment profit in 2001 was $819 million, a
decrease of $167 million, or 17 percent compared with 2000. This decrease
resulted principally from lower sales for our Automation and Control Products
and Service businesses, higher raw material costs and pricing pressures across
the segment, higher retirement benefit costs and the impact of prior year
divestitures. This decrease was partially offset by the impact of cost-reduction
actions, primarily workforce reductions.
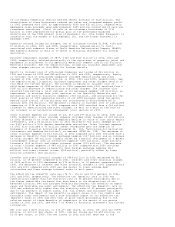
Specialty Materials sales in 2002 were $3,205 million, a decrease of $108
million, or 3 percent compared with 2001. This decrease was driven by a 44
percent decline in sales for our Advanced Circuits business due to weakness in
the telecommunications industry and the divestiture of our PFC business. Sales
declined by 7 percent for our Performance Fibers business mainly due to weak
demand. Sales for our Fluorines business also declined by 2 percent generally
due to lower demand and pricing pressures. This decrease was partially offset by
higher sales for our Electronic Materials and Nylon System businesses of 8 and 5
percent, respectively, due principally to increased demand. Specialty Materials
sales in 2001 were $3,313 million, a decrease of $742 million, or 18 percent
compared with 2000. Excluding the effect of divestitures, sales decreased by 13
percent. This decrease was driven by a decline in sales for our Electronic
Materials and Advanced Circuits businesses of 36 and 34 percent, respectively,
due to weakness in the electronics and telecommunications markets. Sales also
declined for our Performance Fibers and Nylon System businesses by 18 and 8
percent, respectively, due to weakness in the automotive and carpet end-markets.
Specialty Materials segment profit in 2002 was $57 million, an increase of $5
million, or 10 percent compared with 2001. Excluding goodwill amortization
expense in 2001, segment profit in 2002 decreased by 32 percent compared with
2001. Segment profit in 2002 was negatively impacted by significant pricing
pressures in many of our markets and by start-up costs for our new Fluorines
plant. This decrease in segment profit was partially offset by the impact of
higher volumes in our Electronic Materials and Nylon System businesses, lower
raw material costs, and lower costs resulting from plant shutdowns and workforce
reductions. Specialty Materials segment profit in 2001 was $52 million, a
decrease of $282 million, or 84 percent compared with 2000. This decrease
resulted primarily from lower volumes and price declines, principally in our
Electronic Materials, Nylon System and Performance Fibers businesses. Higher
energy and raw material costs principally in our Nylon System and Performance
Fibers businesses and the impact of prior year divestitures also contributed to
the decrease in segment profit. This decrease in segment profit was partially
offset by the impact of cost-reduction actions, principally plant shutdowns and
workforce reductions.
Transportation and Power Systems sales in 2002 were $3,184 million, a decrease
of $273 million, or 8 percent compared with 2001. Excluding the effect of the
disposition of our BCVS business, sales increased by 3 percent. This increase
was due mainly to a 6 percent increase in sales for our Garrett Engine Boosting
Systems business due to higher build rates for medium and heavy-duty vehicles in
Asia and North America. Sales for our Consumer Products Group and Friction
Materials businesses also both increased 2 percent due to higher demand and
favorable foreign exchange. Transportation and Power Systems sales in 2001 were
$3,457 million, a decrease of $70 million, or 2 percent compared with 2000.
Excluding the effects of foreign exchange, acquisitions and divestitures, sales
were flat. Sales increased by 13 percent for our Garrett Engine Boosting Systems
business due to continued strong demand for turbochargers in the European
diesel-powered passenger car market. This increase was offset by a 16 percent
decrease in sales for our BCVS business due to decreased heavy-duty truck builds


