Honeywell 2002 Annual Report Download - page 244
Download and view the complete annual report
Please find page 244 of the 2002 Honeywell annual report below. You can navigate through the pages in the report by either clicking on the pages listed below, or by using the keyword search tool below to find specific information within the annual report.-
 1
1 -
2
-
3
-
4
-
5
-
6
-
7
-
8
-
9
-
10
-
11
-
12
-
13
-
14
-
15
-
16
-
17
-
18
-
19
-
20
-
21
-
22
-
23
-
24
-
25
-
26
-
27
-
28
-
29
-
30
-
31
-
32
-
33
-
34
-
35
-
36
-
37
-
38
-
39
-
40
-
41
-
42
-
43
-
44
-
45
-
46
-
47
-
48
-
49
-
50
-
51
-
52
-
53
-
54
-
55
-
56
-
57
-
58
-
59
-
60
-
61
-
62
-
63
-
64
-
65
-
66
-
67
-
68
-
69
-
70
-
71
-
72
-
73
-
74
-
75
-
76
-
77
-
78
-
79
-
80
-
81
-
82
-
83
-
84
-
85
-
86
-
87
-
88
-
89
-
90
-
91
-
92
-
93
-
94
-
95
-
96
-
97
-
98
-
99
-
100
-
101
-
102
-
103
-
104
-
105
-
106
-
107
-
108
-
109
-
110
-
111
-
112
-
113
-
114
-
115
-
116
-
117
-
118
-
119
-
120
-
121
-
122
-
123
-
124
-
125
-
126
-
127
-
128
-
129
-
130
-
131
-
132
-
133
-
134
-
135
-
136
-
137
-
138
-
139
-
140
-
141
-
142
-
143
-
144
-
145
-
146
-
147
-
148
-
149
-
150
-
151
-
152
-
153
-
154
-
155
-
156
-
157
-
158
-
159
-
160
-
161
-
162
-
163
-
164
-
165
-
166
-
167
-
168
-
169
-
170
-
171
-
172
-
173
-
174
-
175
-
176
-
177
-
178
-
179
-
180
-
181
-
182
-
183
-
184
-
185
-
186
-
187
-
188
-
189
-
190
-
191
-
192
-
193
-
194
-
195
-
196
-
197
-
198
-
199
-
200
-
201
-
202
-
203
-
204
-
205
-
206
-
207
-
208
-
209
-
210
-
211
-
212
-
213
-
214
-
215
-
216
-
217
-
218
-
219
-
220
-
221
-
222
-
223
-
224
-
225
-
226
-
227
-
228
-
229
-
230
-
231
-
232
-
233
-
 234
234 -
 235
235 -
 236
236 -
 237
237 -
 238
238 -
 239
239 -
 240
240 -
 241
241 -
 242
242 -
 243
243 -
 244
244 -
 245
245 -
 246
246 -
 247
247 -
 248
248 -
 249
249 -
 250
250 -
 251
251 -
 252
252 -
 253
253 -
 254
254 -
255
-
256
-
257
-
258
-
259
-
260
-
261
-
262
-
263
-
264
-
265
-
266
-
267
-
268
-
269
-
270
-
271
-
272
-
273
-
274
-
275
-
276
-
277
-
278
-
279
-
280
-
281
-
282
-
283
-
284
-
285
-
286
-
287
-
288
-
289
-
290
-
291
-
292
-
293
-
294
-
295
-
296
-
297
 |
 |
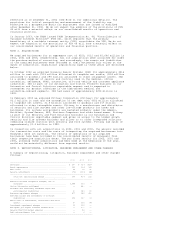
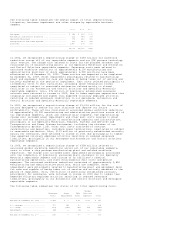
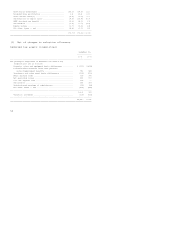
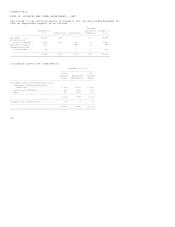
The following table summarizes the pretax impact of total repositioning,
litigation, business impairment and other charges by reportable business
segment.
2002 2001 2000
--------------------------------------------------------------------------------
Aerospace ............................................ $ 146 $ 895 $ 91
Automation and Control Solutions ..................... 212 785 108
Specialty Materials .................................. 976 242 399
Transportation and Power Systems ..................... 295 367 263
Corporate ............................................ 1,430 506 105
--------------------------------------------------------------------------------
$3,059 $2,795 $966
================================================================================
In 2002, we recognized a repositioning charge of $453 million for workforce
reductions across all of our reportable segments and our UOP process technology
joint venture. The charge also related to costs for the planned shutdown and
consolidation of manufacturing plants in our Specialty Materials and Automation
and Control Solutions reportable segments. Severance costs were related to
announced workforce reductions of approximately 8,100 manufacturing and
administrative positions of which approximately 2,900 positions have been
eliminated as of December 31, 2002. These actions are expected to be completed
by December 31, 2003. Asset impairments principally related to manufacturing
plant and equipment held for sale and capable of being taken out of service and
actively marketed in the period of impairment. Exit costs related principally to
incremental costs to exit facilities, including lease termination losses
negotiated or subject to reasonable estimation related mainly to closed
facilities in our Automation and Control Solutions and Specialty Materials
reportable segments. Also, $76 million of previously established severance
accruals were returned to income in 2002, due to fewer employee separations than
originally anticipated and higher than expected voluntary employee attrition
resulting in reduced severance liabilities in our Aerospace, Automation and
Control Solutions and Specialty Materials reportable segments.
In 2001, we recognized a repositioning charge of $1,016 million for the cost of
actions designed to reduce our cost structure and improve our future
profitability. These actions consisted of announced global workforce reductions
of approximately 20,000 manufacturing and administrative positions across all of
our reportable segments, which are substantially complete. The repositioning
charge also included asset impairments and other exit costs related to plant
closures and the rationalization of manufacturing capacity and infrastructure,
principally in our Specialty Materials, Engines, Systems and Services and
Transportation and Power Systems businesses, including the shutdown of our
Turbogenerator product line. Other exit costs consisted of contract
cancellations and penalties, including lease terminations, negotiated or subject
to reasonable estimation. Also, $119 million of previously established accruals,
mainly for severance, were returned to income in 2001 due principally to higher
than expected voluntary employee attrition resulting in reduced severance
liabilities, principally in our Aerospace and Automation and Control Solutions
reportable segments.
In 2000, we recognized a repositioning charge of $338 million related to
announced global workforce reductions across all of our reportable segments,
costs to close a chip package manufacturing plant and related workforce
reductions. The charge also included asset impairments principally associated
with the completion of previously announced plant shutdowns in our Specialty
Materials reportable segment and closure of an affiliate's chemical
manufacturing operations, and other environmental exit costs and period
expenses. The announced workforce reductions consisted of approximately 2,800
manufacturing and administrative positions, which are complete. Asset
impairments were principally related to manufacturing plant and equipment held
for sale and capable of being taken out of service and actively marketed in the
period of impairment. Also, $46 million of previously established accruals,
principally for severance, were returned to income in 2000 due to higher than
expected voluntary employee attrition resulting in reduced severance
liabilities, principally in our Automation and Control Solutions and Aerospace
reportable segments.
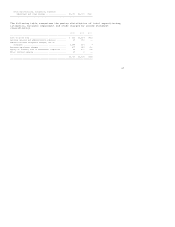
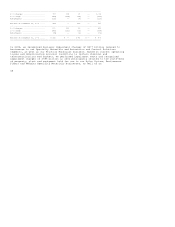
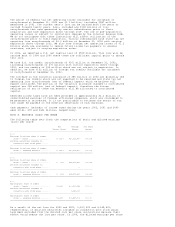
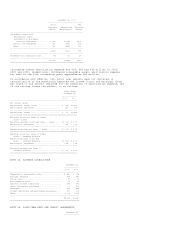
The following table summarizes the status of our total repositioning costs.
Merger
Severance Asset Exit Fees and
Costs Impairments Costs Expenses Total
----------------------------------------------------------------------------------------
Balance at December 31, 1999 ..... $ 424 $ -- $ 85 $ 58 $ 567
----------------------------------------------------------------------------------------
2000 charges ..................... 157 141 40 -- 338
2000 usage ....................... (303) (141) (41) (58) (543)
Adjustments ...................... (42) -- (4) -- (46)
----------------------------------------------------------------------------------------
Balance at December 31, 2000 ..... 236 -- 80 -- 316