Honeywell 2002 Annual Report Download - page 205
Download and view the complete annual report
Please find page 205 of the 2002 Honeywell annual report below. You can navigate through the pages in the report by either clicking on the pages listed below, or by using the keyword search tool below to find specific information within the annual report.-
 1
1 -
2
-
3
-
4
-
5
-
6
-
7
-
8
-
9
-
10
-
11
-
12
-
13
-
14
-
15
-
16
-
17
-
18
-
19
-
20
-
21
-
22
-
23
-
24
-
25
-
26
-
27
-
28
-
29
-
30
-
31
-
32
-
33
-
34
-
35
-
36
-
37
-
38
-
39
-
40
-
41
-
42
-
43
-
44
-
45
-
46
-
47
-
48
-
49
-
50
-
51
-
52
-
53
-
54
-
55
-
56
-
57
-
58
-
59
-
60
-
61
-
62
-
63
-
64
-
65
-
66
-
67
-
68
-
69
-
70
-
71
-
72
-
73
-
74
-
75
-
76
-
77
-
78
-
79
-
80
-
81
-
82
-
83
-
84
-
85
-
86
-
87
-
88
-
89
-
90
-
91
-
92
-
93
-
94
-
95
-
96
-
97
-
98
-
99
-
100
-
101
-
102
-
103
-
104
-
105
-
106
-
107
-
108
-
109
-
110
-
111
-
112
-
113
-
114
-
115
-
116
-
117
-
118
-
119
-
120
-
121
-
122
-
123
-
124
-
125
-
126
-
127
-
128
-
129
-
130
-
131
-
132
-
133
-
134
-
135
-
136
-
137
-
138
-
139
-
140
-
141
-
142
-
143
-
144
-
145
-
146
-
147
-
148
-
149
-
150
-
151
-
152
-
153
-
154
-
155
-
156
-
157
-
158
-
159
-
160
-
161
-
162
-
163
-
164
-
165
-
166
-
167
-
168
-
169
-
170
-
171
-
172
-
173
-
174
-
175
-
176
-
177
-
178
-
179
-
180
-
181
-
182
-
183
-
184
-
185
-
186
-
187
-
188
-
189
-
190
-
191
-
192
-
193
-
194
-
 195
195 -
 196
196 -
 197
197 -
 198
198 -
 199
199 -
 200
200 -
 201
201 -
 202
202 -
 203
203 -
 204
204 -
 205
205 -
 206
206 -
 207
207 -
 208
208 -
 209
209 -
 210
210 -
 211
211 -
 212
212 -
 213
213 -
 214
214 -
 215
215 -
216
-
217
-
218
-
219
-
220
-
221
-
222
-
223
-
224
-
225
-
226
-
227
-
228
-
229
-
230
-
231
-
232
-
233
-
234
-
235
-
236
-
237
-
238
-
239
-
240
-
241
-
242
-
243
-
244
-
245
-
246
-
247
-
248
-
249
-
250
-
251
-
252
-
253
-
254
-
255
-
256
-
257
-
258
-
259
-
260
-
261
-
262
-
263
-
264
-
265
-
266
-
267
-
268
-
269
-
270
-
271
-
272
-
273
-
274
-
275
-
276
-
277
-
278
-
279
-
280
-
281
-
282
-
283
-
284
-
285
-
286
-
287
-
288
-
289
-
290
-
291
-
292
-
293
-
294
-
295
-
296
-
297
 |
 |
MANAGEMENT'S DISCUSSION AND ANALYSIS
Honeywell International Inc.
RESULTS OF OPERATIONS
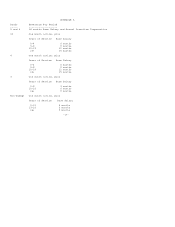
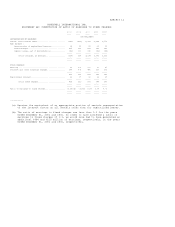
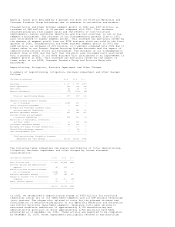
Net sales in 2002 were $22,274 million, a decrease of $1,378 million, or 6
percent compared with 2001. Net sales in 2001 were $23,652 million, a decrease
of $1,371 million, or 5 percent compared with 2000. The change in net sales in
2002 and 2001 is attributable to the following:
2002 2001
Versus Versus
2001 2000
----------------------------------------------------------
Acquisitions ........................... --% 1%
Divestitures ........................... (3) (2)
Price .................................. (2) (1)
Volume ................................. (2) (2)
Foreign Exchange ....................... 1 (1)
----------------------------------------------------------
(6)% (5)%
==========================================================
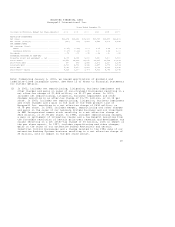
Cost of goods sold of $17,615, $20,125 and $18,673 million in 2002, 2001 and
2000, respectively, included net repositioning and other charges of $561, $2,134
and $413 million in 2002, 2001 and 2000, respectively. See the repositioning,
litigation, business impairment and other charges section of this Management's
Discussion and Analysis of Financial Condition and Results of Operations (MD&A)
for further details. Cost of goods sold in 2001 and 2000 also included $204 and
$206 million, respectively, of amortization of goodwill and indefinite-lived
intangible assets. Such amortization expense was excluded from cost of goods
sold in 2002 in conformity with Statement of Financial Accounting Standards No.
142, "Goodwill and Other Intangible Assets" (SFAS No. 142), which we adopted
January 1, 2002. See Note 1 and 13 of Notes to Financial Statements for further
discussion of the adoption of SFAS No. 142. The decrease in cost of goods sold
of $2,510 million in 2002 compared with 2001 resulted from a $1,573 million
reduction in repositioning and other charges, a $733 million reduction due
principally to lower sales in our Aerospace segment and lower costs due to the
benefits of repositioning actions, mainly workforce reductions, and the
elimination of goodwill and indefinite-lived intangible asset amortization of
$204 million. The increase in cost of goods sold of $1,452 million in 2001
compared with 2000 resulted from a $1,721 million increase in repositioning and
other charges partially offset by a $269 million decrease in cost of goods sold
due principally to lower sales in our Specialty Materials and Aerospace segments
and lower costs due to the benefits of repositioning actions, mainly workforce
reductions.
Selling, general and administrative expenses were $2,757, $3,064 and $3,134
million in 2002, 2001 and 2000, respectively. Selling, general and
administrative expenses included net repositioning and other charges of $45 and
$151 million in 2002 and 2001, respectively. See the repositioning, litigation,
business impairment and other charges section of this MD&A for further details.
The decrease in selling, general and administrative expenses of $307 million in
2002 compared with 2001 resulted from a $106 million reduction in repositioning
and other charges, as well as a $201 million reduction due to lower sales in
2002 and lower costs due to the benefits of repositioning actions, mainly
workforce reductions. The decrease in selling, general and administrative
expenses of $70 million in 2001 compared with 2000 resulted from a $221 million
reduction due to lower sales in 2001 and lower costs due to the benefits of
repositioning actions, mainly workforce reductions, partially offset by a $151
million increase in repositioning and other charges.
Retirement benefit (pension and other postretirement) plans income was $27
million in 2002 compared with income of $165 million in 2001. The decrease in
income of $138 million was due principally to the poor investment performance of
our U.S. pension fund assets since 2000. Retirement benefit plans income was
$165 million in 2001 compared with income of $282 million in 2000. The decrease
in income of $117 million was mainly due to the poor investment performance of
our U.S. pension fund assets and higher retiree medical costs. See Note 22 of
Notes to Financial Statements for further details on our pension and
postretirement plans. Future effects on operating results will principally
depend on pension plan investment performance and other economic conditions. See
Critical Accounting Policies section of this MD&A for a further discussion of
our U.S. pension plans and their impact on our consolidated results of
operations and financial position.
Loss on sale of non-strategic businesses of $124 million in 2002 represented the
pretax loss on the dispositions of Specialty Chemical's Pharmaceutical Fine
Chemicals (PFC) and Advanced Circuits businesses and Automation and Control
Solutions Consumer Products business totaling $249 million, partially offset by
the pretax gain on the disposition