Honeywell 2002 Annual Report Download - page 276
Download and view the complete annual report
Please find page 276 of the 2002 Honeywell annual report below. You can navigate through the pages in the report by either clicking on the pages listed below, or by using the keyword search tool below to find specific information within the annual report.-
 1
1 -
2
-
3
-
4
-
5
-
6
-
7
-
8
-
9
-
10
-
11
-
12
-
13
-
14
-
15
-
16
-
17
-
18
-
19
-
20
-
21
-
22
-
23
-
24
-
25
-
26
-
27
-
28
-
29
-
30
-
31
-
32
-
33
-
34
-
35
-
36
-
37
-
38
-
39
-
40
-
41
-
42
-
43
-
44
-
45
-
46
-
47
-
48
-
49
-
50
-
51
-
52
-
53
-
54
-
55
-
56
-
57
-
58
-
59
-
60
-
61
-
62
-
63
-
64
-
65
-
66
-
67
-
68
-
69
-
70
-
71
-
72
-
73
-
74
-
75
-
76
-
77
-
78
-
79
-
80
-
81
-
82
-
83
-
84
-
85
-
86
-
87
-
88
-
89
-
90
-
91
-
92
-
93
-
94
-
95
-
96
-
97
-
98
-
99
-
100
-
101
-
102
-
103
-
104
-
105
-
106
-
107
-
108
-
109
-
110
-
111
-
112
-
113
-
114
-
115
-
116
-
117
-
118
-
119
-
120
-
121
-
122
-
123
-
124
-
125
-
126
-
127
-
128
-
129
-
130
-
131
-
132
-
133
-
134
-
135
-
136
-
137
-
138
-
139
-
140
-
141
-
142
-
143
-
144
-
145
-
146
-
147
-
148
-
149
-
150
-
151
-
152
-
153
-
154
-
155
-
156
-
157
-
158
-
159
-
160
-
161
-
162
-
163
-
164
-
165
-
166
-
167
-
168
-
169
-
170
-
171
-
172
-
173
-
174
-
175
-
176
-
177
-
178
-
179
-
180
-
181
-
182
-
183
-
184
-
185
-
186
-
187
-
188
-
189
-
190
-
191
-
192
-
193
-
194
-
195
-
196
-
197
-
198
-
199
-
200
-
201
-
202
-
203
-
204
-
205
-
206
-
207
-
208
-
209
-
210
-
211
-
212
-
213
-
214
-
215
-
216
-
217
-
218
-
219
-
220
-
221
-
222
-
223
-
224
-
225
-
226
-
227
-
228
-
229
-
230
-
231
-
232
-
233
-
234
-
235
-
236
-
237
-
238
-
239
-
240
-
241
-
242
-
243
-
244
-
245
-
246
-
247
-
248
-
249
-
250
-
251
-
252
-
253
-
254
-
255
-
256
-
257
-
258
-
259
-
260
-
261
-
262
-
263
-
264
-
265
-
 266
266 -
 267
267 -
 268
268 -
 269
269 -
 270
270 -
 271
271 -
 272
272 -
 273
273 -
 274
274 -
 275
275 -
 276
276 -
 277
277 -
 278
278 -
 279
279 -
 280
280 -
 281
281 -
 282
282 -
 283
283 -
 284
284 -
 285
285 -
 286
286 -
287
-
288
-
289
-
290
-
291
-
292
-
293
-
294
-
295
-
296
-
297
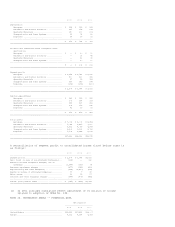
 |
 |
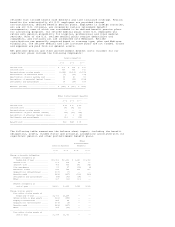
2002 2001 2000
--------------------------------------------------------------------------------
Depreciation
Aerospace ..................................... $ 224 $ 232 $ 268
Automation and Control Solutions .............. 167 178 178
Specialty Materials ........................... 180 199 204
Transportation and Power Systems .............. 66 78 89
Corporate ..................................... 34 37 52
--------------------------------------------------------------------------------
$ 671 $ 724 $ 791
================================================================================
Goodwill and indefinite-lived intangible asset
amortization
Aerospace ..................................... $ -- $ 60 $ 60
Automation and Control Solutions .............. -- 92 86
Specialty Materials ........................... -- 32 40
Transportation and Power Systems .............. -- 20 20
--------------------------------------------------------------------------------
$ -- $ 204 $ 206
================================================================================
Segment profit
Aerospace ..................................... $ 1,358 $ 1,741 $ 2,195
Automation and Control Solutions .............. 890 819 986
Specialty Materials ........................... 57 52 334
Transportation and Power Systems .............. 357 289 274
Corporate ..................................... (154) (153) (160)
--------------------------------------------------------------------------------
$ 2,508 $ 2,748 $ 3,629
================================================================================
Capital expenditures
Aerospace ..................................... $ 182 $ 212 $ 225
Automation and Control Solutions .............. 106 154 193
Specialty Materials ........................... 233 325 261
Transportation and Power Systems .............. 108 172 145
Corporate ..................................... 42 13 29
--------------------------------------------------------------------------------
$ 671 $ 876 $ 853
================================================================================
Total assets
Aerospace ..................................... $ 7,094 $ 8,003 $ 8,454
Automation and Control Solutions .............. 7,044 6,827 7,510
Specialty Materials ........................... 3,512 4,053 4,243
Transportation and Power Systems .............. 2,201 2,195 2,792
Corporate ..................................... 7,708 3,148 2,176
--------------------------------------------------------------------------------
$27,559 $24,226 $25,175
================================================================================
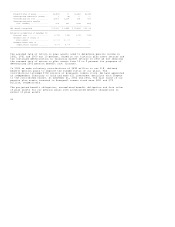
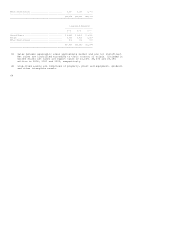
A reconciliation of segment profit to consolidated income (loss) before taxes is
as follows:
2002 2001 2000
-------------------------------------------------------------------------------
Segment profit.................................... $ 2,508 $ 2,748 $3,629
Gain (loss) on sale of non-strategic businesses... (124) -- 112
Asbestos related litigation charges, net of
insurance ..................................... (1,548) (159) (7)
Business impairment charges ...................... (877) (145) (410)
Repositioning and other charges(1) ............... (634) (2,490) (549)
Equity in income of affiliated companies ......... 55 7 47
Other income ..................................... 19 22 57
Interest and other financial charges ............. (344) (405) (481)
-------------------------------------------------------------------------------
Income (loss) before taxes ....................... $ (945) $ (422) $2,398
===============================================================================
(1) In 2001 includes cumulative effect adjustment of $1 million of income
related to adoption of SFAS No. 133.
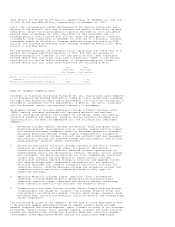
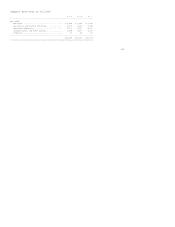
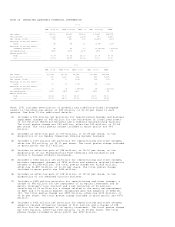
NOTE 24. GEOGRAPHIC AREAS -- FINANCIAL DATA
Net Sales(1)
---------------------------
2002 2001 2000
--------------------------------------------------------------------------------
United States .................................... $15,522 $17,421 $18,007
Europe ........................................... 4,192 4,264 4,313