Honeywell 2002 Annual Report Download - page 254
Download and view the complete annual report
Please find page 254 of the 2002 Honeywell annual report below. You can navigate through the pages in the report by either clicking on the pages listed below, or by using the keyword search tool below to find specific information within the annual report.-
 1
1 -
2
-
3
-
4
-
5
-
6
-
7
-
8
-
9
-
10
-
11
-
12
-
13
-
14
-
15
-
16
-
17
-
18
-
19
-
20
-
21
-
22
-
23
-
24
-
25
-
26
-
27
-
28
-
29
-
30
-
31
-
32
-
33
-
34
-
35
-
36
-
37
-
38
-
39
-
40
-
41
-
42
-
43
-
44
-
45
-
46
-
47
-
48
-
49
-
50
-
51
-
52
-
53
-
54
-
55
-
56
-
57
-
58
-
59
-
60
-
61
-
62
-
63
-
64
-
65
-
66
-
67
-
68
-
69
-
70
-
71
-
72
-
73
-
74
-
75
-
76
-
77
-
78
-
79
-
80
-
81
-
82
-
83
-
84
-
85
-
86
-
87
-
88
-
89
-
90
-
91
-
92
-
93
-
94
-
95
-
96
-
97
-
98
-
99
-
100
-
101
-
102
-
103
-
104
-
105
-
106
-
107
-
108
-
109
-
110
-
111
-
112
-
113
-
114
-
115
-
116
-
117
-
118
-
119
-
120
-
121
-
122
-
123
-
124
-
125
-
126
-
127
-
128
-
129
-
130
-
131
-
132
-
133
-
134
-
135
-
136
-
137
-
138
-
139
-
140
-
141
-
142
-
143
-
144
-
145
-
146
-
147
-
148
-
149
-
150
-
151
-
152
-
153
-
154
-
155
-
156
-
157
-
158
-
159
-
160
-
161
-
162
-
163
-
164
-
165
-
166
-
167
-
168
-
169
-
170
-
171
-
172
-
173
-
174
-
175
-
176
-
177
-
178
-
179
-
180
-
181
-
182
-
183
-
184
-
185
-
186
-
187
-
188
-
189
-
190
-
191
-
192
-
193
-
194
-
195
-
196
-
197
-
198
-
199
-
200
-
201
-
202
-
203
-
204
-
205
-
206
-
207
-
208
-
209
-
210
-
211
-
212
-
213
-
214
-
215
-
216
-
217
-
218
-
219
-
220
-
221
-
222
-
223
-
224
-
225
-
226
-
227
-
228
-
229
-
230
-
231
-
232
-
233
-
234
-
235
-
236
-
237
-
238
-
239
-
240
-
241
-
242
-
243
-
 244
244 -
 245
245 -
 246
246 -
 247
247 -
 248
248 -
 249
249 -
 250
250 -
 251
251 -
 252
252 -
 253
253 -
 254
254 -
 255
255 -
 256
256 -
 257
257 -
 258
258 -
 259
259 -
 260
260 -
 261
261 -
 262
262 -
 263
263 -
 264
264 -
265
-
266
-
267
-
268
-
269
-
270
-
271
-
272
-
273
-
274
-
275
-
276
-
277
-
278
-
279
-
280
-
281
-
282
-
283
-
284
-
285
-
286
-
287
-
288
-
289
-
290
-
291
-
292
-
293
-
294
-
295
-
296
-
297
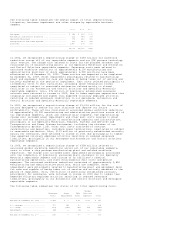
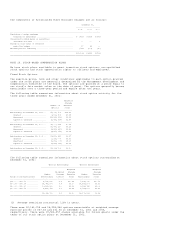
 |
 |
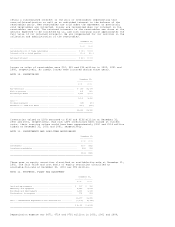
December 31, 2001
----------------------------------
Gross Net
Carrying Accumulated Carrying
Amount Amortization Amount
-----------------------------------------------------------------------
Intangible assets with
determinable lives:
Investments in Aerospace
customer incentives ........ $ 685 $ (78) $607
Patents and trademarks ........ 412 (276) 136
Other ......................... 320 (185) 135
-----------------------------------------------------------------------
1,417 (539) 878
-----------------------------------------------------------------------
Trademark with indefinite life ... 46 (9) 37
-----------------------------------------------------------------------
$1,463 $(548) $915
=======================================================================
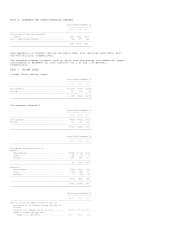
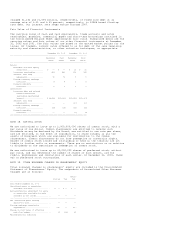
Intangible assets amortization expense was $59, $56 and $60 million in 2002,
2001 and 2000, respectively. Estimated intangible assets amortization expense
for each of the five succeeding years approximates $60 million.
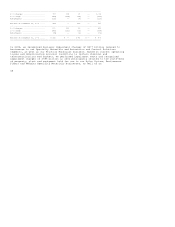
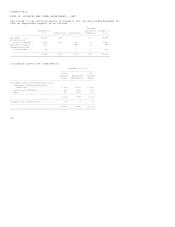
In accordance with SFAS No. 142, prior year amounts were not restated. A
reconciliation of the previously reported net income (loss) and earnings (loss)
per share to the amounts adjusted for the reduction of amortization expense, net
of the related income tax effect, is as follows:
Years Ended
December 31,
---------------
2001 2000
-----------------------------------------------------------------
Net Income (Loss)
Reported net income (loss) .................... $ (99) $1,659
Amortization adjustment ....................... 196 197
-----------------------------------------------------------------
Adjusted net income ........................... $ 97 $1,856
=================================================================
Earnings (loss) per share of common
stock-- basic
Reported earnings (loss) per share -- basic ... $(0.12) $ 2.07
Amortization adjustment ....................... 0.24 0.25
-----------------------------------------------------------------
Adjusted earnings per share -- basic .......... $ 0.12 $ 2.32
=================================================================
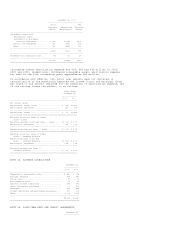
Earnings (loss) per share of common
stock -- assuming dilution
Reported earnings (loss) per
share -- assuming dilution ................. $(0.12) $ 2.05
Amortization adjustment ....................... 0.24 0.24
-----------------------------------------------------------------
Adjusted earnings per share --
assuming dilution .......................... $ 0.12 $ 2.29
=================================================================
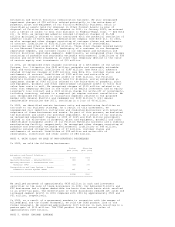
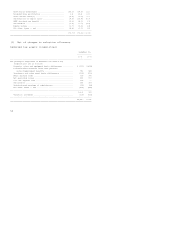
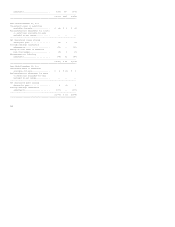
NOTE 14. ACCRUED LIABILITIES
December 31,
---------------
2002 2001
-------------------------------------------------------------------
Compensation and benefit costs .................. $ 440 $ 638
Customer advances ............................... 458 489
Income taxes .................................... 56 31
Environmental costs ............................. 75 81
Asbestos related liabilities .................... 741 182
Litton litigation settlement .................... -- 220
Severance ....................................... 325 484
Product warranties and performance guarantees ... 179 178
Other ........................................... 2,018 1,516
-------------------------------------------------------------------
$4,292 $3,819
===================================================================
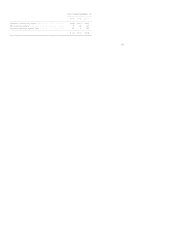
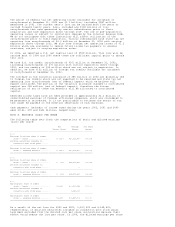
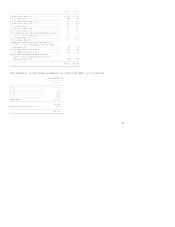
NOTE 15. LONG-TERM DEBT AND CREDIT AGREEMENTS
December 31,
---------------