Honeywell 2002 Annual Report Download - page 202
Download and view the complete annual report
Please find page 202 of the 2002 Honeywell annual report below. You can navigate through the pages in the report by either clicking on the pages listed below, or by using the keyword search tool below to find specific information within the annual report.-
 1
1 -
2
-
3
-
4
-
5
-
6
-
7
-
8
-
9
-
10
-
11
-
12
-
13
-
14
-
15
-
16
-
17
-
18
-
19
-
20
-
21
-
22
-
23
-
24
-
25
-
26
-
27
-
28
-
29
-
30
-
31
-
32
-
33
-
34
-
35
-
36
-
37
-
38
-
39
-
40
-
41
-
42
-
43
-
44
-
45
-
46
-
47
-
48
-
49
-
50
-
51
-
52
-
53
-
54
-
55
-
56
-
57
-
58
-
59
-
60
-
61
-
62
-
63
-
64
-
65
-
66
-
67
-
68
-
69
-
70
-
71
-
72
-
73
-
74
-
75
-
76
-
77
-
78
-
79
-
80
-
81
-
82
-
83
-
84
-
85
-
86
-
87
-
88
-
89
-
90
-
91
-
92
-
93
-
94
-
95
-
96
-
97
-
98
-
99
-
100
-
101
-
102
-
103
-
104
-
105
-
106
-
107
-
108
-
109
-
110
-
111
-
112
-
113
-
114
-
115
-
116
-
117
-
118
-
119
-
120
-
121
-
122
-
123
-
124
-
125
-
126
-
127
-
128
-
129
-
130
-
131
-
132
-
133
-
134
-
135
-
136
-
137
-
138
-
139
-
140
-
141
-
142
-
143
-
144
-
145
-
146
-
147
-
148
-
149
-
150
-
151
-
152
-
153
-
154
-
155
-
156
-
157
-
158
-
159
-
160
-
161
-
162
-
163
-
164
-
165
-
166
-
167
-
168
-
169
-
170
-
171
-
172
-
173
-
174
-
175
-
176
-
177
-
178
-
179
-
180
-
181
-
182
-
183
-
184
-
185
-
186
-
187
-
188
-
189
-
190
-
191
-
 192
192 -
 193
193 -
 194
194 -
 195
195 -
 196
196 -
 197
197 -
 198
198 -
 199
199 -
 200
200 -
 201
201 -
 202
202 -
 203
203 -
 204
204 -
 205
205 -
 206
206 -
 207
207 -
 208
208 -
 209
209 -
 210
210 -
 211
211 -
 212
212 -
213
-
214
-
215
-
216
-
217
-
218
-
219
-
220
-
221
-
222
-
223
-
224
-
225
-
226
-
227
-
228
-
229
-
230
-
231
-
232
-
233
-
234
-
235
-
236
-
237
-
238
-
239
-
240
-
241
-
242
-
243
-
244
-
245
-
246
-
247
-
248
-
249
-
250
-
251
-
252
-
253
-
254
-
255
-
256
-
257
-
258
-
259
-
260
-
261
-
262
-
263
-
264
-
265
-
266
-
267
-
268
-
269
-
270
-
271
-
272
-
273
-
274
-
275
-
276
-
277
-
278
-
279
-
280
-
281
-
282
-
283
-
284
-
285
-
286
-
287
-
288
-
289
-
290
-
291
-
292
-
293
-
294
-
295
-
296
-
297
 |
 |
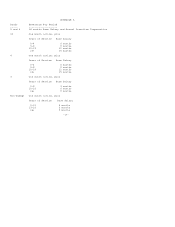
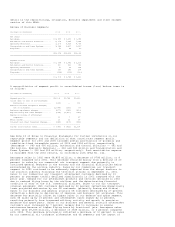
EXHIBIT 12
HONEYWELL INTERNATIONAL INC.
STATEMENT RE: COMPUTATION OF RATIO OF EARNINGS TO FIXED CHARGES
2002 2001 2000 1999 1998
---- ---- ---- ---- ----
(IN MILLIONS)
DETERMINATION OF EARNINGS:
Income (loss) before taxes........................... (945) (422) 2,398 2,248 2,772
Add (Deduct):
Amortization of capitalized interest............. 24 25 25 25 25
Fixed charges.................................... 435 512 583 362 362
Equity income, net of distributions.............. (42) 199 132 (46) (44)
----- ----- ----- ----- -----
Total earnings, as defined................... (528) 314 3,138 2,589 3,115
----- ----- ----- ----- -----
----- ----- ----- ----- -----
FIXED CHARGES:
Rents(a)............................................. 91 107 102 97 87
Interest and other financial charges................. 344 405 481 265 275
----- ----- ----- ----- -----
435 512 583 362 362
Capitalized interest................................. 21 17 16 22 25
----- ----- ----- ----- -----
Total fixed charges.......................... 456 529 599 384 387
----- ----- ----- ----- -----
----- ----- ----- ----- -----
Ratio of earnings to fixed charges................... (1.16)(b) 0.59(b) 5.24 6.74 8.05
----- ----- ----- ----- -----
----- ----- ----- ----- -----
---------
(a) Denotes the equivalent of an appropriate portion of rentals representative
of the interest factor on all rentals other than for capitalized leases.
(b) The ratio of earnings to fixed charges was less than 1:1 for the years
ended December 31, 2002 and 2001. In order to have achieved a ratio of
earnings to fixed charges of 1:1, we would have had to have generated an
additional $984 and $215 million of earnings, respectively, in the years
ended December 31, 2002 and 2001, respectively.