Honeywell 2002 Annual Report Download - page 238
Download and view the complete annual report
Please find page 238 of the 2002 Honeywell annual report below. You can navigate through the pages in the report by either clicking on the pages listed below, or by using the keyword search tool below to find specific information within the annual report.-
 1
1 -
2
-
3
-
4
-
5
-
6
-
7
-
8
-
9
-
10
-
11
-
12
-
13
-
14
-
15
-
16
-
17
-
18
-
19
-
20
-
21
-
22
-
23
-
24
-
25
-
26
-
27
-
28
-
29
-
30
-
31
-
32
-
33
-
34
-
35
-
36
-
37
-
38
-
39
-
40
-
41
-
42
-
43
-
44
-
45
-
46
-
47
-
48
-
49
-
50
-
51
-
52
-
53
-
54
-
55
-
56
-
57
-
58
-
59
-
60
-
61
-
62
-
63
-
64
-
65
-
66
-
67
-
68
-
69
-
70
-
71
-
72
-
73
-
74
-
75
-
76
-
77
-
78
-
79
-
80
-
81
-
82
-
83
-
84
-
85
-
86
-
87
-
88
-
89
-
90
-
91
-
92
-
93
-
94
-
95
-
96
-
97
-
98
-
99
-
100
-
101
-
102
-
103
-
104
-
105
-
106
-
107
-
108
-
109
-
110
-
111
-
112
-
113
-
114
-
115
-
116
-
117
-
118
-
119
-
120
-
121
-
122
-
123
-
124
-
125
-
126
-
127
-
128
-
129
-
130
-
131
-
132
-
133
-
134
-
135
-
136
-
137
-
138
-
139
-
140
-
141
-
142
-
143
-
144
-
145
-
146
-
147
-
148
-
149
-
150
-
151
-
152
-
153
-
154
-
155
-
156
-
157
-
158
-
159
-
160
-
161
-
162
-
163
-
164
-
165
-
166
-
167
-
168
-
169
-
170
-
171
-
172
-
173
-
174
-
175
-
176
-
177
-
178
-
179
-
180
-
181
-
182
-
183
-
184
-
185
-
186
-
187
-
188
-
189
-
190
-
191
-
192
-
193
-
194
-
195
-
196
-
197
-
198
-
199
-
200
-
201
-
202
-
203
-
204
-
205
-
206
-
207
-
208
-
209
-
210
-
211
-
212
-
213
-
214
-
215
-
216
-
217
-
218
-
219
-
220
-
221
-
222
-
223
-
224
-
225
-
226
-
227
-
 228
228 -
 229
229 -
 230
230 -
 231
231 -
 232
232 -
 233
233 -
 234
234 -
 235
235 -
 236
236 -
 237
237 -
 238
238 -
 239
239 -
 240
240 -
 241
241 -
 242
242 -
 243
243 -
 244
244 -
 245
245 -
 246
246 -
 247
247 -
 248
248 -
249
-
250
-
251
-
252
-
253
-
254
-
255
-
256
-
257
-
258
-
259
-
260
-
261
-
262
-
263
-
264
-
265
-
266
-
267
-
268
-
269
-
270
-
271
-
272
-
273
-
274
-
275
-
276
-
277
-
278
-
279
-
280
-
281
-
282
-
283
-
284
-
285
-
286
-
287
-
288
-
289
-
290
-
291
-
292
-
293
-
294
-
295
-
296
-
297
 |
 |
forecasts, general and industry trends and, economic projections and anticipated
cash flows. An impairment is assessed when the undiscounted expected future cash
flows derived from an asset are less than its carrying amount. Impairment losses
are measured as the amount by which the carrying value of an asset exceeds its
fair value and are recognized in earnings. We also continually evaluate the
estimated useful lives of all long-lived assets and periodically revise such
estimates based on current events.
Sales Recognition
Product and service sales are recognized when persuasive evidence of an
arrangement exists, product delivery has occurred or services have been
rendered, pricing is fixed or determinable, and collection is reasonably
assured. Sales under long-term contracts in the Aerospace and Automation and
Control Solutions segments are recorded on a percentage-of-completion method
measured on the cost-to-cost basis for engineering-type contracts and the
units-of-delivery basis for production-type contracts. Provisions for
anticipated losses on long-term contracts are recorded in full when such losses
become evident. Revenues from contracts with multiple element arrangements are
recognized as each element is earned based on the relative fair value of each
element and when there are no undelivered elements that are essential to the
functionality of the delivered elements. Amounts allocated to each element are
based on its objectively determined fair value, such as the sales price for the
product or service when it is sold separately or competitor prices for similar
products or services.
Aerospace Customer Incentives
We offer sales incentives to commercial aircraft manufacturers and airlines in
connection with their selection of our products. These incentives may consist of
free products, credits, discounts or upfront cash payments. The cost of these
incentives is recognized in the period incurred unless the incentive is subject
to recovery through a long-term product maintenance requirement mandated by the
Federal Aviation Administration for certified replacement equipment and service.
Amounts capitalized at December 31, 2002 and 2001 were $662 and $607 million,
respectively, and are being recognized over the estimated minimum life of the
aircraft (up to 25 years) as a reduction in future sales or increase in cost of
goods sold based on the type of incentive granted. We routinely evaluate the
recoverability of these amounts based on forecasted replacement equipment sales
over the estimated minimum life of the aircraft. See Note 13 for additional
details.
Environmental Expenditures
Environmental expenditures that relate to current operations are expensed or
capitalized as appropriate. Expenditures that relate to an existing condition
caused by past operations, and that do not provide future benefits, are expensed
as incurred. Liabilities are recorded when environmental assessments are made or
remedial efforts are probable and the costs can be reasonably estimated. The
timing of these accruals is generally no later than the completion of
feasibility studies. The liabilities for environmental costs recorded in Accrued
Liabilities and Other Liabilities at December 31, 2002 were $75 and $360
million, respectively, and at December 31, 2001 were $81 and $375 million,
respectively.
Research and Development
Research and development costs for company-sponsored research and development
projects are expensed as incurred. Such costs are classified as part of Cost of
Goods Sold and were $757, $832 and $818 million in 2002, 2001 and 2000,
respectively.
Stock-Based Compensation Plans
We account for our fixed stock option plans under Accounting Principles Board
Opinion No. 25, "Accounting for Stock Issued to Employees" (APB No. 25).
Accordingly, no compensation cost is recognized for our fixed stock option
plans. Statement of Financial Accounting Standards No. 123, "Accounting for
Stock-Based Compensation" (SFAS No. 123) allows, but does not require, companies
to record compensation cost for fixed stock option plans using a fair value
based method. As permitted by SFAS No. 123, we elected to continue to account
for compensation cost for our fixed stock option plans using the intrinsic value
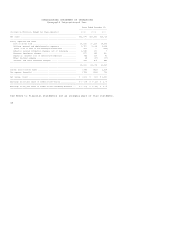
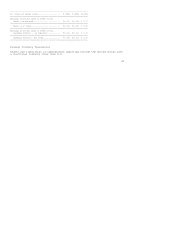
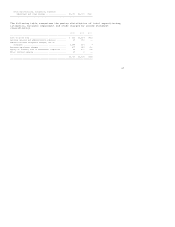
based method under APB No. 25. The following table sets forth pro forma
information as if compensation cost had been determined consistent with the
requirements of SFAS No. 123.
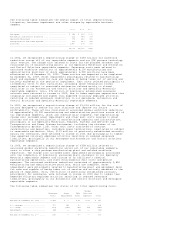
2002 2001 2000
---------------------------------------------------------------------------
Net income (loss), as reported.................. $ (220) $ (99) $1,659
Deduct: Total stock-based employee
compensation cost determined under fair
value method for fixed stock option
plans, net of related tax effects............ (64) (85) (75)