Honeywell 2002 Annual Report Download - page 250
Download and view the complete annual report
Please find page 250 of the 2002 Honeywell annual report below. You can navigate through the pages in the report by either clicking on the pages listed below, or by using the keyword search tool below to find specific information within the annual report.-
 1
1 -
2
-
3
-
4
-
5
-
6
-
7
-
8
-
9
-
10
-
11
-
12
-
13
-
14
-
15
-
16
-
17
-
18
-
19
-
20
-
21
-
22
-
23
-
24
-
25
-
26
-
27
-
28
-
29
-
30
-
31
-
32
-
33
-
34
-
35
-
36
-
37
-
38
-
39
-
40
-
41
-
42
-
43
-
44
-
45
-
46
-
47
-
48
-
49
-
50
-
51
-
52
-
53
-
54
-
55
-
56
-
57
-
58
-
59
-
60
-
61
-
62
-
63
-
64
-
65
-
66
-
67
-
68
-
69
-
70
-
71
-
72
-
73
-
74
-
75
-
76
-
77
-
78
-
79
-
80
-
81
-
82
-
83
-
84
-
85
-
86
-
87
-
88
-
89
-
90
-
91
-
92
-
93
-
94
-
95
-
96
-
97
-
98
-
99
-
100
-
101
-
102
-
103
-
104
-
105
-
106
-
107
-
108
-
109
-
110
-
111
-
112
-
113
-
114
-
115
-
116
-
117
-
118
-
119
-
120
-
121
-
122
-
123
-
124
-
125
-
126
-
127
-
128
-
129
-
130
-
131
-
132
-
133
-
134
-
135
-
136
-
137
-
138
-
139
-
140
-
141
-
142
-
143
-
144
-
145
-
146
-
147
-
148
-
149
-
150
-
151
-
152
-
153
-
154
-
155
-
156
-
157
-
158
-
159
-
160
-
161
-
162
-
163
-
164
-
165
-
166
-
167
-
168
-
169
-
170
-
171
-
172
-
173
-
174
-
175
-
176
-
177
-
178
-
179
-
180
-
181
-
182
-
183
-
184
-
185
-
186
-
187
-
188
-
189
-
190
-
191
-
192
-
193
-
194
-
195
-
196
-
197
-
198
-
199
-
200
-
201
-
202
-
203
-
204
-
205
-
206
-
207
-
208
-
209
-
210
-
211
-
212
-
213
-
214
-
215
-
216
-
217
-
218
-
219
-
220
-
221
-
222
-
223
-
224
-
225
-
226
-
227
-
228
-
229
-
230
-
231
-
232
-
233
-
234
-
235
-
236
-
237
-
238
-
239
-
 240
240 -
 241
241 -
 242
242 -
 243
243 -
 244
244 -
 245
245 -
 246
246 -
 247
247 -
 248
248 -
 249
249 -
 250
250 -
 251
251 -
 252
252 -
 253
253 -
 254
254 -
 255
255 -
 256
256 -
 257
257 -
 258
258 -
 259
259 -
 260
260 -
261
-
262
-
263
-
264
-
265
-
266
-
267
-
268
-
269
-
270
-
271
-
272
-
273
-
274
-
275
-
276
-
277
-
278
-
279
-
280
-
281
-
282
-
283
-
284
-
285
-
286
-
287
-
288
-
289
-
290
-
291
-
292
-
293
-
294
-
295
-
296
-
297
 |
 |
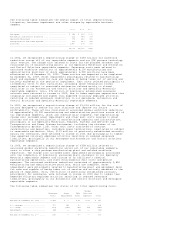
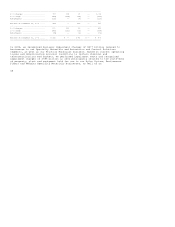
The amount of federal tax net operating losses available for carryback or
carryforward at December 31, 2002 was $1.1 billion, including $987 million
generated in 2002. The current year's loss can be carried back five years or
carried forward twenty years. Also, included are $118 million of loss
carryforwards that were generated by certain subsidiaries prior to their
acquisition and have expiration dates through 2019. The use of pre-acquisition
operating losses is subject to limitations imposed by the Internal Revenue Code.
We do not anticipate that these limitations will affect utilization of the
carryforwards prior to their expiration. Various subsidiaries have state tax net
operating loss carryforwards of $4.2 billion at December 31, 2002 with varying
expiration dates through 2022. We also have foreign net operating losses of $1.2
billion which are available to reduce future income tax payments in several
countries, subject to varying expiration rules.
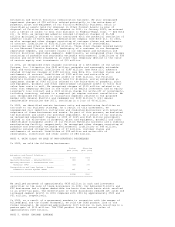
In 2002, we reported a U.S. net capital loss of $559 million. This loss will be
carried back to 1999 and 2000 where there are sufficient capital gains to absorb
this loss.
We have U.S. tax credit carryforwards of $101 million at December 31, 2002,
including carryforwards of $71 million with various expiration dates through
2022, and tax credits of $30 million which are not subject to expiration. In
addition, we have $152 million of foreign tax credits available for carryback
or carryforward at December 31, 2002.
The increase in the valuation allowance of $80 million in 2002 was primarily due
to foreign tax credits which are not expected to be realized and state tax net
operating loss carryforwards (net of federal impact) which we believe will
expire unutilized. The portion of the valuation allowance charged to contributed
capital was $18 million (net of federal impact), therefore the future
realization of any of these tax benefits will be allocated to contributed
capital.
Deferred income taxes have not been provided on approximately $2.2 billion of
undistributed earnings of foreign affiliated companies, which are considered to
be permanently reinvested. It is not practicable to estimate the amount of tax
that might be payable on the eventual remittance of such earnings.
Cash payments (refunds) of income taxes during the years 2002, 2001 and 2000
were $(14), $79 and $442 million, respectively.
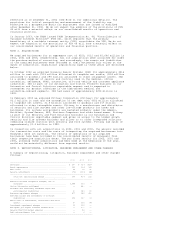
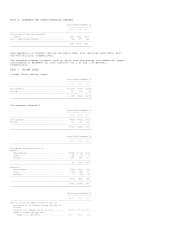
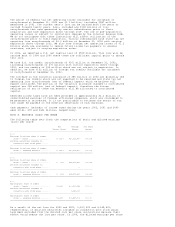
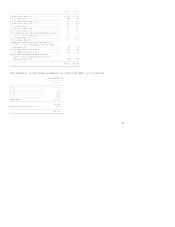
NOTE 8. EARNINGS (LOSS) PER SHARE
The following table sets forth the computations of basic and diluted earnings
(loss) per share:
Net Average Per Share
Income (Loss) Shares Amount
--------------------------------------------------------------------------------
2002
Earnings (loss) per share of common
stock -- basic .................... $ (220) 820,292,870 $(0.27)
Dilutive securities issuable in
connection with stock plans ....... --
--------------------------------------------------------------------------------
Earnings (loss) per share of common
stock -- assuming dilution ........ $ (220) 820,292,870 $(0.27)
================================================================================
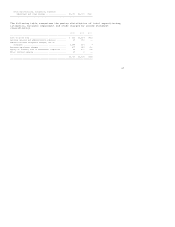
2001
Earnings (loss) per share of common
stock -- basic .................... $ (99) 812,273,417 $(0.12)
Dilutive securities issuable in
connection with stock plans ....... --
--------------------------------------------------------------------------------
Earnings (loss) per share of common
stock -- assuming dilution ........ $ (99) 812,273,417 $(0.12)
================================================================================
2000
Earnings per share of common
stock -- basic .................... $1,659 800,317,543 $ 2.07
Dilutive securities issuable in
connection with stock plans ....... 9,149,959
--------------------------------------------------------------------------------
Earnings per share of common
stock -- assuming dilution ........ $1,659 809,467,502 $ 2.05
================================================================================
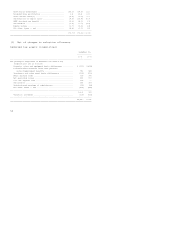
As a result of the net loss for 2002 and 2001, 2,527,229 and 4,269,601,
respectively, of dilutive securities issuable in connection with stock plans
have been excluded from the diluted loss per share calculations because their
effect would reduce the loss per share. In 2000, the diluted earnings per share