Honeywell 2002 Annual Report Download - page 234
Download and view the complete annual report
Please find page 234 of the 2002 Honeywell annual report below. You can navigate through the pages in the report by either clicking on the pages listed below, or by using the keyword search tool below to find specific information within the annual report.-
 1
1 -
2
-
3
-
4
-
5
-
6
-
7
-
8
-
9
-
10
-
11
-
12
-
13
-
14
-
15
-
16
-
17
-
18
-
19
-
20
-
21
-
22
-
23
-
24
-
25
-
26
-
27
-
28
-
29
-
30
-
31
-
32
-
33
-
34
-
35
-
36
-
37
-
38
-
39
-
40
-
41
-
42
-
43
-
44
-
45
-
46
-
47
-
48
-
49
-
50
-
51
-
52
-
53
-
54
-
55
-
56
-
57
-
58
-
59
-
60
-
61
-
62
-
63
-
64
-
65
-
66
-
67
-
68
-
69
-
70
-
71
-
72
-
73
-
74
-
75
-
76
-
77
-
78
-
79
-
80
-
81
-
82
-
83
-
84
-
85
-
86
-
87
-
88
-
89
-
90
-
91
-
92
-
93
-
94
-
95
-
96
-
97
-
98
-
99
-
100
-
101
-
102
-
103
-
104
-
105
-
106
-
107
-
108
-
109
-
110
-
111
-
112
-
113
-
114
-
115
-
116
-
117
-
118
-
119
-
120
-
121
-
122
-
123
-
124
-
125
-
126
-
127
-
128
-
129
-
130
-
131
-
132
-
133
-
134
-
135
-
136
-
137
-
138
-
139
-
140
-
141
-
142
-
143
-
144
-
145
-
146
-
147
-
148
-
149
-
150
-
151
-
152
-
153
-
154
-
155
-
156
-
157
-
158
-
159
-
160
-
161
-
162
-
163
-
164
-
165
-
166
-
167
-
168
-
169
-
170
-
171
-
172
-
173
-
174
-
175
-
176
-
177
-
178
-
179
-
180
-
181
-
182
-
183
-
184
-
185
-
186
-
187
-
188
-
189
-
190
-
191
-
192
-
193
-
194
-
195
-
196
-
197
-
198
-
199
-
200
-
201
-
202
-
203
-
204
-
205
-
206
-
207
-
208
-
209
-
210
-
211
-
212
-
213
-
214
-
215
-
216
-
217
-
218
-
219
-
220
-
221
-
222
-
223
-
 224
224 -
 225
225 -
 226
226 -
 227
227 -
 228
228 -
 229
229 -
 230
230 -
 231
231 -
 232
232 -
 233
233 -
 234
234 -
 235
235 -
 236
236 -
 237
237 -
 238
238 -
 239
239 -
 240
240 -
 241
241 -
 242
242 -
 243
243 -
 244
244 -
245
-
246
-
247
-
248
-
249
-
250
-
251
-
252
-
253
-
254
-
255
-
256
-
257
-
258
-
259
-
260
-
261
-
262
-
263
-
264
-
265
-
266
-
267
-
268
-
269
-
270
-
271
-
272
-
273
-
274
-
275
-
276
-
277
-
278
-
279
-
280
-
281
-
282
-
283
-
284
-
285
-
286
-
287
-
288
-
289
-
290
-
291
-
292
-
293
-
294
-
295
-
296
-
297
 |
 |
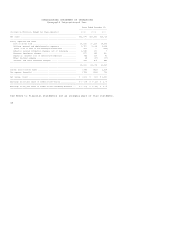
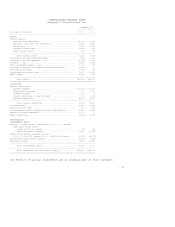
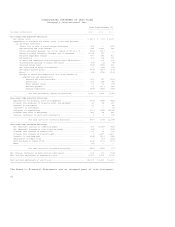
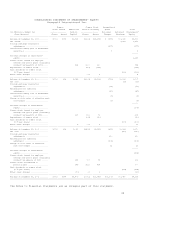
CONSOLIDATED STATEMENT OF CASH FLOWS
Honeywell International Inc.
Years Ended December 31,
--------------------------
(Dollars in Millions) 2002 2001 2000
-----------------------------------------------------------------------------------------------------
CASH FLOWS FROM OPERATING ACTIVITIES
Net income (loss) ................................................... $ (220) $ (99) $ 1,659
Adjustments to reconcile net income (loss) to net cash provided
by operating activities:
(Gain) loss on sale of non-strategic businesses ............... 124 -- (112)
Repositioning and other charges ............................... 634 2,491 549
Litton settlement payment, net of tax refund of $58 in 2002 ... (162) (220) --
Asbestos related litigation charges, net of insurance ......... 1,548 159 7
Business impairment charges ................................... 877 145 410
Depreciation .................................................. 671 724 791
Goodwill and indefinite-lived intangible asset amortization ... -- 204 206
Undistributed earnings of equity affiliates ................... (55) (1) (4)
Deferred income taxes ......................................... (793) (456) 414
Net taxes paid on sales of businesses ......................... -- (42) (97)
Retirement benefit plans ...................................... (408) (380) (509)
Other ......................................................... (46) (178) (201)
Changes in assets and liabilities, net of the effects of
acquisitions and divestitures:
Accounts and notes receivable ........................... 181 651 (560)
Inventories ............................................. 333 168 (45)
Other current assets .................................... 51 51 (73)
Accounts payable ........................................ 63 (400) 186
Accrued liabilities ..................................... (418) (821) (632)
-----------------------------------------------------------------------------------------------------
Net cash provided by operating activities ............ 2,380 1,996 1,989
-----------------------------------------------------------------------------------------------------
CASH FLOWS FROM INVESTING ACTIVITIES
Expenditures for property, plant and equipment ...................... (671) (876) (853)
Proceeds from disposals of property, plant and equipment ............ 41 46 127
Decrease in investments ............................................. 91 -- 88
(Increase) in investments ........................................... -- -- (3)
Cash paid for acquisitions .......................................... (520) (122) (2,523)
Proceeds from sales of businesses ................................... 183 44 467
Decrease (increase) in short-term investments ....................... 6 2 (17)
-----------------------------------------------------------------------------------------------------
Net cash (used for) investing activities ............. (870) (906) (2,714)
-----------------------------------------------------------------------------------------------------
CASH FLOWS FROM FINANCING ACTIVITIES
Net (decrease) increase in commercial paper ......................... 198 (1,189) (831)
Net (decrease) increase in short-term borrowings .................... (46) 9 (191)
Proceeds from issuance of common stock .............................. 41 79 296
Proceeds from issuance of long-term debt ............................ 6 1,237 1,810
Payments of long-term debt .......................................... (428) (390) (389)
Repurchases of common stock ......................................... -- (30) (166)
Cash dividends on common stock ...................................... (614) (609) (599)
Other ............................................................... (39) -- --
-----------------------------------------------------------------------------------------------------
Net cash (used for) financing activities ............. (882) (893) (70)
-----------------------------------------------------------------------------------------------------
Net increase (decrease) in cash and cash equivalents ................... 628 197 (795)
Cash and cash equivalents at beginning of year ......................... 1,393 1,196 1,991
-----------------------------------------------------------------------------------------------------
Cash and cash equivalents at end of year ............................... $2,021 $ 1,393 $ 1,196
=====================================================================================================
The Notes to Financial Statements are an integral part of this statement.
42