Honeywell 2002 Annual Report Download - page 209
Download and view the complete annual report
Please find page 209 of the 2002 Honeywell annual report below. You can navigate through the pages in the report by either clicking on the pages listed below, or by using the keyword search tool below to find specific information within the annual report.-
 1
1 -
2
-
3
-
4
-
5
-
6
-
7
-
8
-
9
-
10
-
11
-
12
-
13
-
14
-
15
-
16
-
17
-
18
-
19
-
20
-
21
-
22
-
23
-
24
-
25
-
26
-
27
-
28
-
29
-
30
-
31
-
32
-
33
-
34
-
35
-
36
-
37
-
38
-
39
-
40
-
41
-
42
-
43
-
44
-
45
-
46
-
47
-
48
-
49
-
50
-
51
-
52
-
53
-
54
-
55
-
56
-
57
-
58
-
59
-
60
-
61
-
62
-
63
-
64
-
65
-
66
-
67
-
68
-
69
-
70
-
71
-
72
-
73
-
74
-
75
-
76
-
77
-
78
-
79
-
80
-
81
-
82
-
83
-
84
-
85
-
86
-
87
-
88
-
89
-
90
-
91
-
92
-
93
-
94
-
95
-
96
-
97
-
98
-
99
-
100
-
101
-
102
-
103
-
104
-
105
-
106
-
107
-
108
-
109
-
110
-
111
-
112
-
113
-
114
-
115
-
116
-
117
-
118
-
119
-
120
-
121
-
122
-
123
-
124
-
125
-
126
-
127
-
128
-
129
-
130
-
131
-
132
-
133
-
134
-
135
-
136
-
137
-
138
-
139
-
140
-
141
-
142
-
143
-
144
-
145
-
146
-
147
-
148
-
149
-
150
-
151
-
152
-
153
-
154
-
155
-
156
-
157
-
158
-
159
-
160
-
161
-
162
-
163
-
164
-
165
-
166
-
167
-
168
-
169
-
170
-
171
-
172
-
173
-
174
-
175
-
176
-
177
-
178
-
179
-
180
-
181
-
182
-
183
-
184
-
185
-
186
-
187
-
188
-
189
-
190
-
191
-
192
-
193
-
194
-
195
-
196
-
197
-
198
-
 199
199 -
 200
200 -
 201
201 -
 202
202 -
 203
203 -
 204
204 -
 205
205 -
 206
206 -
 207
207 -
 208
208 -
 209
209 -
 210
210 -
 211
211 -
 212
212 -
 213
213 -
 214
214 -
 215
215 -
 216
216 -
 217
217 -
 218
218 -
 219
219 -
220
-
221
-
222
-
223
-
224
-
225
-
226
-
227
-
228
-
229
-
230
-
231
-
232
-
233
-
234
-
235
-
236
-
237
-
238
-
239
-
240
-
241
-
242
-
243
-
244
-
245
-
246
-
247
-
248
-
249
-
250
-
251
-
252
-
253
-
254
-
255
-
256
-
257
-
258
-
259
-
260
-
261
-
262
-
263
-
264
-
265
-
266
-
267
-
268
-
269
-
270
-
271
-
272
-
273
-
274
-
275
-
276
-
277
-
278
-
279
-
280
-
281
-
282
-
283
-
284
-
285
-
286
-
287
-
288
-
289
-
290
-
291
-
292
-
293
-
294
-
295
-
296
-
297
 |
 |
detail in the repositioning, litigation, business impairment and other charges
section of this MD&A.
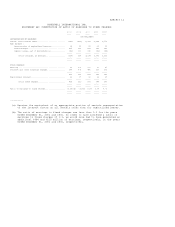
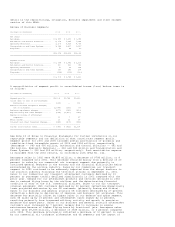
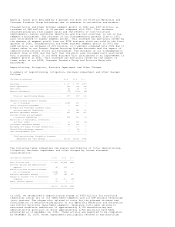
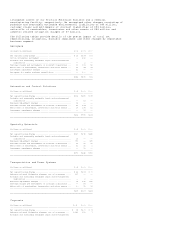
Review of Business Segments
(Dollars in millions) 2002 2001 2000
---------------------------------------------------------------------
Net Sales
Aerospace.............................. $ 8,855 $ 9,653 $ 9,988
Automation and Control Solutions....... 6,978 7,185 7,384
Specialty Materials.................... 3,205 3,313 4,055
Transportation and Power Systems....... 3,184 3,457 3,527
Corporate.............................. 52 44 69
---------------------------------------------------------------------
$22,274 $23,652 $25,023
=====================================================================
Segment Profit
Aerospace.............................. $ 1,358 $ 1,741 $ 2,195
Automation and Control Solutions....... 890 819 986
Specialty Materials.................... 57 52 334
Transportation and Power Systems....... 357 289 274
Corporate.............................. (154) (153) (160)
---------------------------------------------------------------------
$ 2,508 $ 2,748 $ 3,629
=====================================================================
A reconciliation of segment profit to consolidated income (loss) before taxes is
as follows:
(Dollars in millions) 2002 2001 2000
--------------------------------------------------------------------
Segment profit......................... $2,508 $2,748 $3,629
(Loss) gain on sale of non-strategic
businesses.......................... (124) -- 112
Asbestos related litigation charges,
net of insurance.................... (1,548) (159) (7)
Business impairment charges............ (877) (145) (410)
Repositioning and other charges........ (634) (2,490) (549)
Equity in income of affiliated
companies........................... 55 7 47
Other income........................... 19 22 57
Interest and other financial charges... (344) (405) (481)
--------------------------------------------------------------------
Income (loss) before taxes............. $ (945) $ (422) $2,398
====================================================================
See Note 23 of Notes to Financial Statements for further information on our
reportable segments and our definition of what constitutes segment profit.
Segment profit for 2001 and 2000 includes pretax amortization of goodwill and
indefinite-lived intangible assets of $204 and $206 million, respectively
(Aerospace -- $60 and $60 million, Automation and Control Solutions -- $92 and
$86 million, Specialty Materials -- $32 and $40 million and Transportation and
Power Systems -- $20 and $20 million, respectively). Such amortization expense
is excluded from the 2002 results, in conformity with SFAS No. 142.
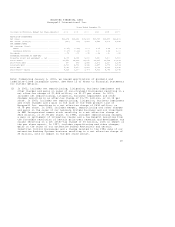
Aerospace sales in 2002 were $8,855 million, a decrease of $798 million, or 8
percent compared with 2001. This decrease resulted mainly from a decline of 20
percent in sales by our commercial air transport segment due primarily to
continued general weakness in the economy and the financial difficulties being
encountered by the airline industry. Sales by our commercial air transport
segment in 2002 continued to be adversely impacted from the abrupt downturn in
the aviation industry following the terrorist attacks on September 11, 2001.
Sales to our commercial air transport aftermarket customers declined by 13
percent as passenger traffic declined significantly in 2002 compared with the
prior year. Demand for our aftermarket products and services declined in 2002
due to reduced flying hours by the airlines and the deteriorating financial
condition of many of the U.S. commercial airlines. Sales to our air transport
original equipment (OE) customers declined by 32 percent reflecting dramatically
lower projected deliveries by our OE customers (primarily Boeing and Airbus).
Sales to our business and general aviation OE customers decreased by 27 percent
reflecting a decline in deliveries of regional and business jet airplanes. This
decrease was partially offset by higher sales in our defense and space segment,
with OE sales up by 13 percent and aftermarket sales higher by 12 percent,
resulting primarily from increased military activity and growth in precision
guidance and spare parts. Sales to our business and general aviation aftermarket
customers also increased by 7 percent largely due to increases in engine
maintenance because of higher flying hours by fractional jets. Aerospace sales
in 2001 were $9,653 million, a decrease of $335 million, or 3 percent compared
with 2000. This decrease principally reflected a decrease of 10 percent in sales
by our commercial air transport aftermarket and OE segments and the impact of