Honeywell 2002 Annual Report Download - page 213
Download and view the complete annual report
Please find page 213 of the 2002 Honeywell annual report below. You can navigate through the pages in the report by either clicking on the pages listed below, or by using the keyword search tool below to find specific information within the annual report.-
 1
1 -
2
-
3
-
4
-
5
-
6
-
7
-
8
-
9
-
10
-
11
-
12
-
13
-
14
-
15
-
16
-
17
-
18
-
19
-
20
-
21
-
22
-
23
-
24
-
25
-
26
-
27
-
28
-
29
-
30
-
31
-
32
-
33
-
34
-
35
-
36
-
37
-
38
-
39
-
40
-
41
-
42
-
43
-
44
-
45
-
46
-
47
-
48
-
49
-
50
-
51
-
52
-
53
-
54
-
55
-
56
-
57
-
58
-
59
-
60
-
61
-
62
-
63
-
64
-
65
-
66
-
67
-
68
-
69
-
70
-
71
-
72
-
73
-
74
-
75
-
76
-
77
-
78
-
79
-
80
-
81
-
82
-
83
-
84
-
85
-
86
-
87
-
88
-
89
-
90
-
91
-
92
-
93
-
94
-
95
-
96
-
97
-
98
-
99
-
100
-
101
-
102
-
103
-
104
-
105
-
106
-
107
-
108
-
109
-
110
-
111
-
112
-
113
-
114
-
115
-
116
-
117
-
118
-
119
-
120
-
121
-
122
-
123
-
124
-
125
-
126
-
127
-
128
-
129
-
130
-
131
-
132
-
133
-
134
-
135
-
136
-
137
-
138
-
139
-
140
-
141
-
142
-
143
-
144
-
145
-
146
-
147
-
148
-
149
-
150
-
151
-
152
-
153
-
154
-
155
-
156
-
157
-
158
-
159
-
160
-
161
-
162
-
163
-
164
-
165
-
166
-
167
-
168
-
169
-
170
-
171
-
172
-
173
-
174
-
175
-
176
-
177
-
178
-
179
-
180
-
181
-
182
-
183
-
184
-
185
-
186
-
187
-
188
-
189
-
190
-
191
-
192
-
193
-
194
-
195
-
196
-
197
-
198
-
199
-
200
-
201
-
202
-
 203
203 -
 204
204 -
 205
205 -
 206
206 -
 207
207 -
 208
208 -
 209
209 -
 210
210 -
 211
211 -
 212
212 -
 213
213 -
 214
214 -
 215
215 -
 216
216 -
 217
217 -
 218
218 -
 219
219 -
 220
220 -
 221
221 -
 222
222 -
 223
223 -
224
-
225
-
226
-
227
-
228
-
229
-
230
-
231
-
232
-
233
-
234
-
235
-
236
-
237
-
238
-
239
-
240
-
241
-
242
-
243
-
244
-
245
-
246
-
247
-
248
-
249
-
250
-
251
-
252
-
253
-
254
-
255
-
256
-
257
-
258
-
259
-
260
-
261
-
262
-
263
-
264
-
265
-
266
-
267
-
268
-
269
-
270
-
271
-
272
-
273
-
274
-
275
-
276
-
277
-
278
-
279
-
280
-
281
-
282
-
283
-
284
-
285
-
286
-
287
-
288
-
289
-
290
-
291
-
292
-
293
-
294
-
295
-
296
-
297
 |
 |
America. Sales also declined by 4 percent for both our Friction Materials and
Consumer Products Group businesses due to weakness in automotive end-markets.
Transportation and Power Systems segment profit in 2002 was $357 million, an
increase of $68 million, or 24 percent compared with 2001. This increase
resulted primarily from higher sales and the effects of cost-structure
improvements, mainly workforce reductions and low-cost sourcing, in all of the
segment's businesses. The shutdown of our Turbogenerator product line in 2001
also contributed to higher segment profit. This increase was partially offset by
the absence of segment profit from our BCVS business which was sold in the first
quarter of 2002. Transportation and Power Systems segment profit in 2001 was
$289 million, an increase of $15 million, or 5 percent compared with 2000 due to
higher sales in our Garrett Engine Boosting Systems business and the impact of
repositioning actions across all businesses. The shutdown of our Turbogenerator
product line in 2001 and the fact that the prior year included costs associated
with a product recall in our BCVS business also contributed to an improvement in
segment profit in 2001. This increase was partially offset by the impact of
lower sales in our BCVS, Consumer Products Group and Friction Materials
businesses.
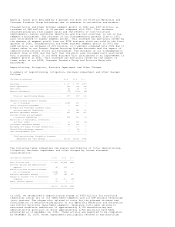
Repositioning, Litigation, Business Impairment and Other Charges
A summary of repositioning, litigation, business impairment and other charges
follows:
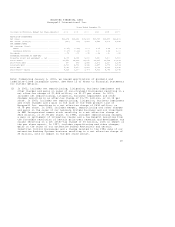
(Dollars in millions) 2002 2001 2000
--------------------------------------------------------------------------
Severance ....................................... $ 270 $ 727 $157
Asset impairments ............................... 121 194 141
Exit costs ...................................... 62 95 40
Reserve adjustments ............................. (76) (119) (46)
--------------------------------------------------------------------------
Total net repositioning charge. .............. 377 897 292
--------------------------------------------------------------------------
Asbestos related litigation charges,
net of insurance ............................. 1,548 159 7
Litton litigation settlement .................... -- 440 --
Probable and reasonably estimable legal
and environmental liabilities ................ 30 249 80
Business impairment charges ..................... 877 145 410
Customer claims and settlements
of contract liabilities ...................... 152 310 93
Write-offs of receivables, inventories
and other assets ............................. 60 335 84
Investment impairment charges ................... 15 112 --
Aerospace jet engine contract cancellation ...... -- 100 --
General Electric merger expenses ................ -- 42 --
Debt extinguishment loss ........................ -- 6 --
--------------------------------------------------------------------------
Total repositioning, litigation, business
impairment and other charges .............. $3,059 $2,795 $966
==========================================================================
The following table summarizes the pretax distribution of total repositioning,
litigation, business impairment and other charges by income statement
classification:
(Dollars in millions) 2002 2001 2000
--------------------------------------------------------------
Cost of goods sold .................. $ 561 $2,134 $413
Selling, general and administrative
expenses ......................... 45 151 --
Asbestos related litigation charges,
net of insurance ................. 1,548 159 7
Business impairment charges ......... 877 145 410
Equity in (income) loss of affiliated
companies ........................ 13 200 136
Other (income) expense .............. 15 6 --
--------------------------------------------------------------
$3,059 $2,795 $966
==============================================================
In 2002, we recognized a repositioning charge of $453 million for workforce
reductions across all of our reportable segments and our UOP process technology
joint venture. The charge also related to costs for the planned shutdown and
consolidation of manufacturing plants in our Specialty Materials and Automation
and Control Solutions reportable segments. Severance costs were related to
announced workforce reductions of approximately 8,100 manufacturing and
administrative positions of which approximately 2,900 positions have been
eliminated as of December 31, 2002. These actions are expected to be completed
by December 31, 2003. Asset impairments principally related to manufacturing