Honeywell 2002 Annual Report Download - page 230
Download and view the complete annual report
Please find page 230 of the 2002 Honeywell annual report below. You can navigate through the pages in the report by either clicking on the pages listed below, or by using the keyword search tool below to find specific information within the annual report.-
 1
1 -
2
-
3
-
4
-
5
-
6
-
7
-
8
-
9
-
10
-
11
-
12
-
13
-
14
-
15
-
16
-
17
-
18
-
19
-
20
-
21
-
22
-
23
-
24
-
25
-
26
-
27
-
28
-
29
-
30
-
31
-
32
-
33
-
34
-
35
-
36
-
37
-
38
-
39
-
40
-
41
-
42
-
43
-
44
-
45
-
46
-
47
-
48
-
49
-
50
-
51
-
52
-
53
-
54
-
55
-
56
-
57
-
58
-
59
-
60
-
61
-
62
-
63
-
64
-
65
-
66
-
67
-
68
-
69
-
70
-
71
-
72
-
73
-
74
-
75
-
76
-
77
-
78
-
79
-
80
-
81
-
82
-
83
-
84
-
85
-
86
-
87
-
88
-
89
-
90
-
91
-
92
-
93
-
94
-
95
-
96
-
97
-
98
-
99
-
100
-
101
-
102
-
103
-
104
-
105
-
106
-
107
-
108
-
109
-
110
-
111
-
112
-
113
-
114
-
115
-
116
-
117
-
118
-
119
-
120
-
121
-
122
-
123
-
124
-
125
-
126
-
127
-
128
-
129
-
130
-
131
-
132
-
133
-
134
-
135
-
136
-
137
-
138
-
139
-
140
-
141
-
142
-
143
-
144
-
145
-
146
-
147
-
148
-
149
-
150
-
151
-
152
-
153
-
154
-
155
-
156
-
157
-
158
-
159
-
160
-
161
-
162
-
163
-
164
-
165
-
166
-
167
-
168
-
169
-
170
-
171
-
172
-
173
-
174
-
175
-
176
-
177
-
178
-
179
-
180
-
181
-
182
-
183
-
184
-
185
-
186
-
187
-
188
-
189
-
190
-
191
-
192
-
193
-
194
-
195
-
196
-
197
-
198
-
199
-
200
-
201
-
202
-
203
-
204
-
205
-
206
-
207
-
208
-
209
-
210
-
211
-
212
-
213
-
214
-
215
-
216
-
217
-
218
-
219
-
 220
220 -
 221
221 -
 222
222 -
 223
223 -
 224
224 -
 225
225 -
 226
226 -
 227
227 -
 228
228 -
 229
229 -
 230
230 -
 231
231 -
 232
232 -
 233
233 -
 234
234 -
 235
235 -
 236
236 -
 237
237 -
 238
238 -
 239
239 -
 240
240 -
241
-
242
-
243
-
244
-
245
-
246
-
247
-
248
-
249
-
250
-
251
-
252
-
253
-
254
-
255
-
256
-
257
-
258
-
259
-
260
-
261
-
262
-
263
-
264
-
265
-
266
-
267
-
268
-
269
-
270
-
271
-
272
-
273
-
274
-
275
-
276
-
277
-
278
-
279
-
280
-
281
-
282
-
283
-
284
-
285
-
286
-
287
-
288
-
289
-
290
-
291
-
292
-
293
-
294
-
295
-
296
-
297
 |
 |
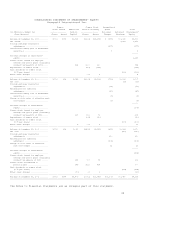
Based on the December 31, 2002 plan asset values of $3.1 billion and an
accumulated benefit obligation of $4.0 billion, we recognized an additional
minimum pension liability resulting in a decrease in Accumulated Other Nonowner
Changes in Shareowners' Equity of approximately $606 million after-tax in 2002.
Equity market returns and interest rates significantly impact the funded status
of our pension plans. Based on future plan asset performance and interest rates,
additional charges to equity might be required.
Long-Lived Assets (including Tangible and Definite-Lived Intangible Assets)
To conduct our global business operations and execute our business strategy, we
acquire tangible and intangible assets. We periodically evaluate the
recoverability of the carrying amount of our long-lived assets (including
property, plant and equipment and definite-lived intangible assets) whenever
events or changes in circumstances indicate that the carrying amount of a
long-lived asset group may not be fully recoverable. These events or changes in
circumstances include business plans and forecasts, economic or competitive
positions within an industry, as well as current operating performance and
anticipated future performance based on a business' competitive position. An
impairment is assessed when the undiscounted expected future cash flows derived
from an asset are less than its carrying amount. Impairment losses are measured
as the amount by which the carrying value of a long-lived asset exceeds its fair
value and are recognized in earnings. We continually apply our best judgment
when applying the impairment rules to determine the timing of the impairment
test, the undiscounted cash flows used to assess impairment, and the fair value
of an impaired long-lived asset group. The dynamic economic environment in which
each of our businesses operate and the resulting assumptions used to estimate
future cash flows impact the outcome of all impairment tests. For information on
recognized impairment charges see the repositioning, litigation, business
impairment and other charges section of this MD&A.
Sales Recognition on Long-Term Contracts
Sales under long-term contracts (primarily in our Aerospace and Automation and
Control Solutions segments) are recorded on a percentage-of-completion method.
This requires us to make judgments in estimating contract revenues, contract
costs and progress toward completion. These judgments form the basis for our
determinations regarding overall contract value, contract profitability and
timing of revenue recognition. Revenue and cost estimates are monitored on an
ongoing basis and revised based on changes in circumstances. Anticipated losses
on long-term contracts are recognized when such losses become evident.
Aerospace Customer Incentives
Similar to most suppliers to commercial aircraft manufacturers and airlines, we
offer sales incentives to commercial aircraft manufacturers and airlines in
connection with their selection of our products. These incentives may consist of
free products, credits, discounts or upfront cash payments. The cost of these
incentives is recognized in the period incurred unless the incentive is subject
to recovery through a long-term product maintenance requirement mandated by the
Federal Aviation Administration for certified replacement equipment and service.
Amounts capitalized at December 31, 2002, 2001 and 2000 were $662, $607 and $507
million, respectively, and are being recognized over the estimated minimum life
of the aircraft (up to 25 years) as a reduction in future sales or increases in
cost of goods sold based on the type of incentive granted. We routinely evaluate
the recoverability of these amounts based on forecasted replacement equipment
sales over the estimated minimum life of the aircraft. For additional
information see Notes 1 and 13 of Notes to Financial Statements.
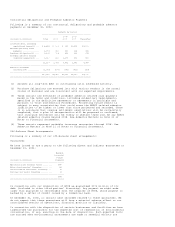
Sales to the U.S. Government
Sales to the U.S. Government, acting through its various departments and
agencies and through prime contractors, amounted to $2,277, $2,491 and $2,219
million in 2002, 2001 and 2000, respectively. This included sales to the
Department of Defense (DoD), as a prime contractor and subcontractor, of $1,833,
$1,631 and $1,548 million in 2002, 2001 and 2000, respectively. Sales to the DoD
accounted for 8.2, 6.9 and 6.2 percent of our total sales in 2002, 2001 and
2000, respectively. U.S. defense spending increased in 2002 and is also expected
to increase in 2003.
Backlog
Our total backlog at year-end 2002 and 2001 was $7,332 and $7,178 million,
respectively. We anticipate that approximately $6,194 million of the 2002
backlog will be filled in 2003. We believe that backlog is not necessarily a
reliable indicator of our future sales because a substantial portion of the
orders constituting this backlog may be canceled at the customer's option.
Inflation
Highly competitive market conditions have minimized inflation's impact on the
selling prices of our products and the costs of our purchased materials. Cost
increases for materials and labor have generally been low, and productivity