Honeywell 2002 Annual Report Download - page 252
Download and view the complete annual report
Please find page 252 of the 2002 Honeywell annual report below. You can navigate through the pages in the report by either clicking on the pages listed below, or by using the keyword search tool below to find specific information within the annual report.-
 1
1 -
2
-
3
-
4
-
5
-
6
-
7
-
8
-
9
-
10
-
11
-
12
-
13
-
14
-
15
-
16
-
17
-
18
-
19
-
20
-
21
-
22
-
23
-
24
-
25
-
26
-
27
-
28
-
29
-
30
-
31
-
32
-
33
-
34
-
35
-
36
-
37
-
38
-
39
-
40
-
41
-
42
-
43
-
44
-
45
-
46
-
47
-
48
-
49
-
50
-
51
-
52
-
53
-
54
-
55
-
56
-
57
-
58
-
59
-
60
-
61
-
62
-
63
-
64
-
65
-
66
-
67
-
68
-
69
-
70
-
71
-
72
-
73
-
74
-
75
-
76
-
77
-
78
-
79
-
80
-
81
-
82
-
83
-
84
-
85
-
86
-
87
-
88
-
89
-
90
-
91
-
92
-
93
-
94
-
95
-
96
-
97
-
98
-
99
-
100
-
101
-
102
-
103
-
104
-
105
-
106
-
107
-
108
-
109
-
110
-
111
-
112
-
113
-
114
-
115
-
116
-
117
-
118
-
119
-
120
-
121
-
122
-
123
-
124
-
125
-
126
-
127
-
128
-
129
-
130
-
131
-
132
-
133
-
134
-
135
-
136
-
137
-
138
-
139
-
140
-
141
-
142
-
143
-
144
-
145
-
146
-
147
-
148
-
149
-
150
-
151
-
152
-
153
-
154
-
155
-
156
-
157
-
158
-
159
-
160
-
161
-
162
-
163
-
164
-
165
-
166
-
167
-
168
-
169
-
170
-
171
-
172
-
173
-
174
-
175
-
176
-
177
-
178
-
179
-
180
-
181
-
182
-
183
-
184
-
185
-
186
-
187
-
188
-
189
-
190
-
191
-
192
-
193
-
194
-
195
-
196
-
197
-
198
-
199
-
200
-
201
-
202
-
203
-
204
-
205
-
206
-
207
-
208
-
209
-
210
-
211
-
212
-
213
-
214
-
215
-
216
-
217
-
218
-
219
-
220
-
221
-
222
-
223
-
224
-
225
-
226
-
227
-
228
-
229
-
230
-
231
-
232
-
233
-
234
-
235
-
236
-
237
-
238
-
239
-
240
-
241
-
 242
242 -
 243
243 -
 244
244 -
 245
245 -
 246
246 -
 247
247 -
 248
248 -
 249
249 -
 250
250 -
 251
251 -
 252
252 -
 253
253 -
 254
254 -
 255
255 -
 256
256 -
 257
257 -
 258
258 -
 259
259 -
 260
260 -
 261
261 -
 262
262 -
263
-
264
-
265
-
266
-
267
-
268
-
269
-
270
-
271
-
272
-
273
-
274
-
275
-
276
-
277
-
278
-
279
-
280
-
281
-
282
-
283
-
284
-
285
-
286
-
287
-
288
-
289
-
290
-
291
-
292
-
293
-
294
-
295
-
296
-
297
 |
 |
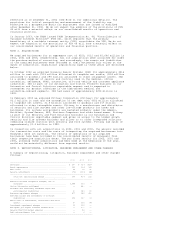
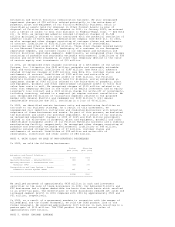
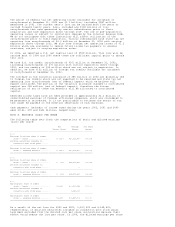
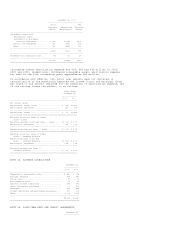
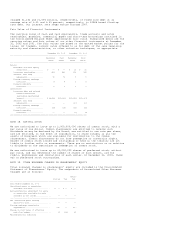
retain a subordinated interest in the pool of receivables representing that
over-collateralization as well as an undivided interest in the balance of the
receivables pools. New receivables are sold under the agreement as previously
sold receivables are collected. Losses are recognized when our interest in the
receivables are sold. The retained interests in the receivables are shown at the
amounts expected to be collected by us, and such carrying value approximates the
fair value of our retained interests. We are compensated for our services in the
collection and administration of the receivables.
December 31,
-------------
2002 2001
--------------------------------------------------------------------------------
Designated pools of trade receivables .......................... $ 911 $ 803
Interest sold to third parties ................................. (500) (500)
--------------------------------------------------------------------------------
Retained interest .............................................. $ 411 $ 303
================================================================================
Losses on sales of receivables were $10, $22 and $34 million in 2002, 2001 and
2000, respectively. No credit losses were incurred during those years.
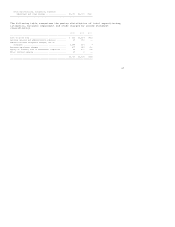
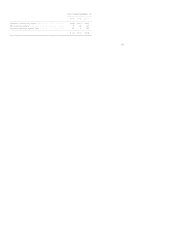
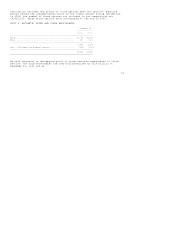
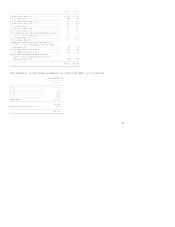
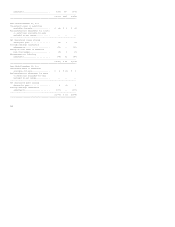
NOTE 10. INVENTORIES
December 31,
---------------
2002 2001
--------------------------------------------------------------------------------
Raw materials ................................................ $ 936 $1,024
Work in process .............................................. 804 869
Finished products ............................................ 1,361 1,603
--------------------------------------------------------------------------------
3,101 3,496
Less --
Progress payments ............................................ (28) (25)
Reduction to LIFO cost basis ................................. (120) (116)
--------------------------------------------------------------------------------
$2,953 $3,355
================================================================================
Inventories valued at LIFO amounted to $146 and $136 million at December 31,
2002 and 2001, respectively. Had such LIFO inventories been valued at current
costs, their carrying values would have been approximately $120 and $116 million
higher at December 31, 2002 and 2001, respectively.
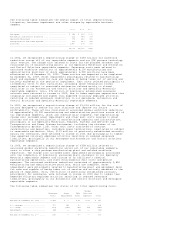
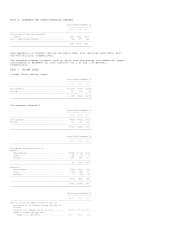
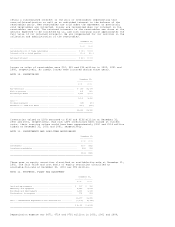
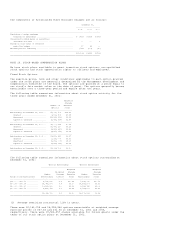
NOTE 11. INVESTMENTS AND LONG-TERM RECEIVABLES
December 31,
------------
2002 2001
--------------------------------------------------------------------------------
Investments ..................................................... $160 $312
Long-term receivables ........................................... 464 154
--------------------------------------------------------------------------------
$624 $466
================================================================================
There were no equity securities classified as available-for-sale at December 31,
2002. The fair value and cost basis of equity securities classified as
available-for-sale at December 31, 2001 was $92 million.
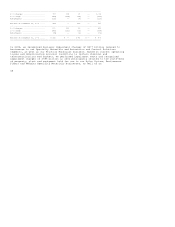
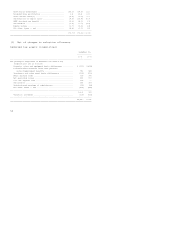
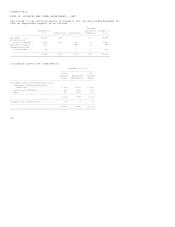
NOTE 12. PROPERTY, PLANT AND EQUIPMENT
December 31,
-----------------
2002 2001
--------------------------------------------------------------------------------
Land and improvements ...................................... $ 297 $ 316
Machinery and equipment .................................... 8,646 8,874
Buildings and improvements ................................. 1,836 1,968
Construction in progress ................................... 378 523
--------------------------------------------------------------------------------
11,157 11,681
Less -- Accumulated depreciation and amortization .......... (7,102) (6,748)
--------------------------------------------------------------------------------
$ 4,055 $ 4,933
================================================================================
Depreciation expense was $671, $724 and $791 million in 2002, 2001 and 2000,