Honeywell 2002 Annual Report Download - page 262
Download and view the complete annual report
Please find page 262 of the 2002 Honeywell annual report below. You can navigate through the pages in the report by either clicking on the pages listed below, or by using the keyword search tool below to find specific information within the annual report.-
 1
1 -
2
-
3
-
4
-
5
-
6
-
7
-
8
-
9
-
10
-
11
-
12
-
13
-
14
-
15
-
16
-
17
-
18
-
19
-
20
-
21
-
22
-
23
-
24
-
25
-
26
-
27
-
28
-
29
-
30
-
31
-
32
-
33
-
34
-
35
-
36
-
37
-
38
-
39
-
40
-
41
-
42
-
43
-
44
-
45
-
46
-
47
-
48
-
49
-
50
-
51
-
52
-
53
-
54
-
55
-
56
-
57
-
58
-
59
-
60
-
61
-
62
-
63
-
64
-
65
-
66
-
67
-
68
-
69
-
70
-
71
-
72
-
73
-
74
-
75
-
76
-
77
-
78
-
79
-
80
-
81
-
82
-
83
-
84
-
85
-
86
-
87
-
88
-
89
-
90
-
91
-
92
-
93
-
94
-
95
-
96
-
97
-
98
-
99
-
100
-
101
-
102
-
103
-
104
-
105
-
106
-
107
-
108
-
109
-
110
-
111
-
112
-
113
-
114
-
115
-
116
-
117
-
118
-
119
-
120
-
121
-
122
-
123
-
124
-
125
-
126
-
127
-
128
-
129
-
130
-
131
-
132
-
133
-
134
-
135
-
136
-
137
-
138
-
139
-
140
-
141
-
142
-
143
-
144
-
145
-
146
-
147
-
148
-
149
-
150
-
151
-
152
-
153
-
154
-
155
-
156
-
157
-
158
-
159
-
160
-
161
-
162
-
163
-
164
-
165
-
166
-
167
-
168
-
169
-
170
-
171
-
172
-
173
-
174
-
175
-
176
-
177
-
178
-
179
-
180
-
181
-
182
-
183
-
184
-
185
-
186
-
187
-
188
-
189
-
190
-
191
-
192
-
193
-
194
-
195
-
196
-
197
-
198
-
199
-
200
-
201
-
202
-
203
-
204
-
205
-
206
-
207
-
208
-
209
-
210
-
211
-
212
-
213
-
214
-
215
-
216
-
217
-
218
-
219
-
220
-
221
-
222
-
223
-
224
-
225
-
226
-
227
-
228
-
229
-
230
-
231
-
232
-
233
-
234
-
235
-
236
-
237
-
238
-
239
-
240
-
241
-
242
-
243
-
244
-
245
-
246
-
247
-
248
-
249
-
250
-
251
-
 252
252 -
 253
253 -
 254
254 -
 255
255 -
 256
256 -
 257
257 -
 258
258 -
 259
259 -
 260
260 -
 261
261 -
 262
262 -
 263
263 -
 264
264 -
 265
265 -
 266
266 -
 267
267 -
 268
268 -
 269
269 -
 270
270 -
 271
271 -
 272
272 -
273
-
274
-
275
-
276
-
277
-
278
-
279
-
280
-
281
-
282
-
283
-
284
-
285
-
286
-
287
-
288
-
289
-
290
-
291
-
292
-
293
-
294
-
295
-
296
-
297
 |
 |
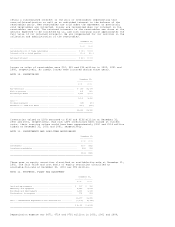
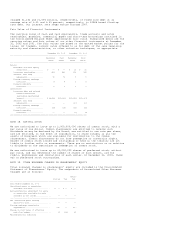
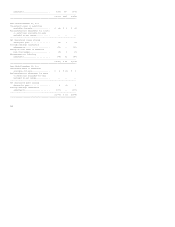
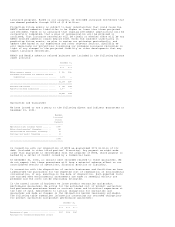
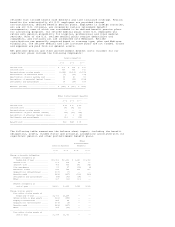
The components of Accumulated Other Nonowner Changes are as follows:
December 31,
-----------------------
2002 2001 2000
---------------------------------------------------------------------------------------
Cumulative foreign exchange
translation adjustment ................................... $ (413) $(723) $(672)
Unrealized holding gains on securities
available-for-sale ....................................... -- -- 3
Change in fair value of effective
cash flow hedges ......................................... 17 (5) --
Minimum pension liability ................................... (713) (107) (60)
---------------------------------------------------------------------------------------
$(1,109) $(835) $(729)
=======================================================================================
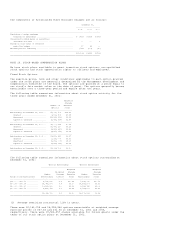
NOTE 20. STOCK-BASED COMPENSATION PLANS
We have stock plans available to grant incentive stock options, non-qualified
stock options and stock appreciation rights to officers and employees.
Fixed Stock Options
The exercise price, term and other conditions applicable to each option granted
under the stock plans are generally determined by the Management Development and
Compensation Committee of the Board. The options are granted at a price equal to
our stock's fair market value on the date of grant. The options generally become
exercisable over a three-year period and expire after ten years.
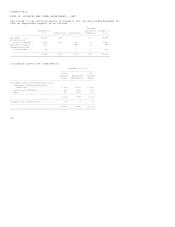
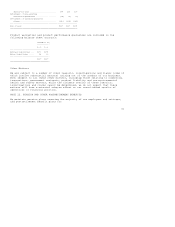
The following table summarizes information about stock option activity for the
three years ended December 31, 2002:
Weighted
Average
Number of Exercise
Options Price
------------------------------------------------------------
Outstanding at December 31, 1999 .. 56,040,503 $36.81
Granted ........................ 4,506,804 45.68
Exercised ...................... (12,115,659) 23.22
Lapsed or canceled ............. (2,431,324) 52.87
------------------------------------------------------------
Outstanding at December 31, 2000 .. 46,000,324 40.36
Granted ........................ 15,479,120 36.23
Exercised ...................... (3,121,867) 21.49
Lapsed or canceled ............. (4,477,952) 51.24
------------------------------------------------------------
Outstanding at December 31, 2001 .. 53,879,625 39.37
Granted ........................ 2,996,005 33.61
Exercised ...................... (1,692,005) 18.15
Lapsed or canceled ............. (3,168,916) 43.14
------------------------------------------------------------
Outstanding at December 31, 2002 .. 52,014,709 39.50
============================================================
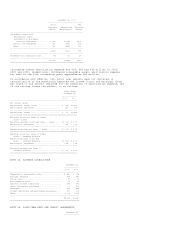
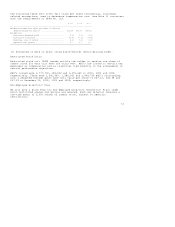
The following table summarizes information about stock options outstanding at
December 31, 2002:
Options Outstanding Options Exercisable
----------------------------------------------------------
Weighted Weighted
Weighted Average Average
Number Average Exercise Number Exercise
Range of exercise prices Outstanding Life(1) Price Exercisable Price
----------------------------------------------------------------------------------------
$16.00 - $29.79 ........... 8,796,515 2.3 $20.88 7,545,015 $20.76
$30.14 - $39.94 ........... 24,086,509 7.4 36.10 14,583,207 36.39
$40.02 - $49.97 ........... 10,265,929 6.0 43.39 9,286,785 43.09
$50.13 - $66.73 ........... 8,865,756 6.9 62.66 6,764,201 62.62
----------------------------------------------------------------------------------------
52,014,709 6.2 39.50 38,179,208 39.58
========================================================================================
(1) Average remaining contractual life in years.
There were 30,142,728 and 26,998,346 options exercisable at weighted average
exercise prices of $37.66 and $32.06 at December 31, 2001 and 2000,
respectively. There were 19,524,057 shares available for future grants under the
terms of our stock option plans at December 31, 2002.