Honeywell 2002 Annual Report Download - page 232
Download and view the complete annual report
Please find page 232 of the 2002 Honeywell annual report below. You can navigate through the pages in the report by either clicking on the pages listed below, or by using the keyword search tool below to find specific information within the annual report.-
 1
1 -
2
-
3
-
4
-
5
-
6
-
7
-
8
-
9
-
10
-
11
-
12
-
13
-
14
-
15
-
16
-
17
-
18
-
19
-
20
-
21
-
22
-
23
-
24
-
25
-
26
-
27
-
28
-
29
-
30
-
31
-
32
-
33
-
34
-
35
-
36
-
37
-
38
-
39
-
40
-
41
-
42
-
43
-
44
-
45
-
46
-
47
-
48
-
49
-
50
-
51
-
52
-
53
-
54
-
55
-
56
-
57
-
58
-
59
-
60
-
61
-
62
-
63
-
64
-
65
-
66
-
67
-
68
-
69
-
70
-
71
-
72
-
73
-
74
-
75
-
76
-
77
-
78
-
79
-
80
-
81
-
82
-
83
-
84
-
85
-
86
-
87
-
88
-
89
-
90
-
91
-
92
-
93
-
94
-
95
-
96
-
97
-
98
-
99
-
100
-
101
-
102
-
103
-
104
-
105
-
106
-
107
-
108
-
109
-
110
-
111
-
112
-
113
-
114
-
115
-
116
-
117
-
118
-
119
-
120
-
121
-
122
-
123
-
124
-
125
-
126
-
127
-
128
-
129
-
130
-
131
-
132
-
133
-
134
-
135
-
136
-
137
-
138
-
139
-
140
-
141
-
142
-
143
-
144
-
145
-
146
-
147
-
148
-
149
-
150
-
151
-
152
-
153
-
154
-
155
-
156
-
157
-
158
-
159
-
160
-
161
-
162
-
163
-
164
-
165
-
166
-
167
-
168
-
169
-
170
-
171
-
172
-
173
-
174
-
175
-
176
-
177
-
178
-
179
-
180
-
181
-
182
-
183
-
184
-
185
-
186
-
187
-
188
-
189
-
190
-
191
-
192
-
193
-
194
-
195
-
196
-
197
-
198
-
199
-
200
-
201
-
202
-
203
-
204
-
205
-
206
-
207
-
208
-
209
-
210
-
211
-
212
-
213
-
214
-
215
-
216
-
217
-
218
-
219
-
220
-
221
-
 222
222 -
 223
223 -
 224
224 -
 225
225 -
 226
226 -
 227
227 -
 228
228 -
 229
229 -
 230
230 -
 231
231 -
 232
232 -
 233
233 -
 234
234 -
 235
235 -
 236
236 -
 237
237 -
 238
238 -
 239
239 -
 240
240 -
 241
241 -
 242
242 -
243
-
244
-
245
-
246
-
247
-
248
-
249
-
250
-
251
-
252
-
253
-
254
-
255
-
256
-
257
-
258
-
259
-
260
-
261
-
262
-
263
-
264
-
265
-
266
-
267
-
268
-
269
-
270
-
271
-
272
-
273
-
274
-
275
-
276
-
277
-
278
-
279
-
280
-
281
-
282
-
283
-
284
-
285
-
286
-
287
-
288
-
289
-
290
-
291
-
292
-
293
-
294
-
295
-
296
-
297
 |
 |
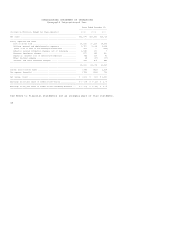
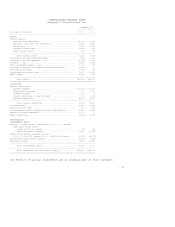
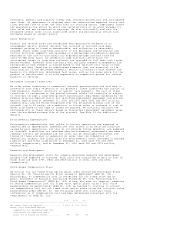
CONSOLIDATED STATEMENT OF OPERATIONS
Honeywell International Inc.
Years Ended December 31,
---------------------------
(Dollars in Millions, Except Per Share Amounts) 2002 2001 2000
----------------------------------------------------------------------------------------------
Net sales ...................................................... $22,274 $23,652 $25,023
----------------------------------------------------------------------------------------------
Costs, expenses and other
Cost of goods sold .......................................... 17,615 20,125 18,673
Selling, general and administrative expenses ................ 2,757 3,064 3,134
(Gain) loss on sale of non-strategic businesses ............. 124 -- (112)
Asbestos related litigation charges, net of insurance ....... 1,548 159 7
Business impairment charges ................................. 877 145 410
Equity in (income) loss of affiliated companies ............. (42) 193 89
Other (income) expense ...................................... (4) (17) (57)
Interest and other financial charges ........................ 344 405 481
----------------------------------------------------------------------------------------------
23,219 24,074 22,625
----------------------------------------------------------------------------------------------
Income (loss) before taxes ..................................... (945) (422) 2,398
Tax expense (benefit) .......................................... (725) (323) 739
----------------------------------------------------------------------------------------------
Net income (loss) .............................................. $ (220) $ (99) $ 1,659
==============================================================================================
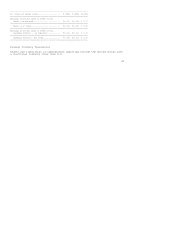
Earnings (loss) per share of common stock--basic ............... $ (0.27) $ (0.12) $ 2.07
==============================================================================================
Earnings (loss) per share of common stock--assuming dilution ... $ (0.27) $ (0.12) $ 2.05
==============================================================================================
The Notes to Financial Statements are an integral part of this statement.
40