Honeywell 2002 Annual Report Download - page 204
Download and view the complete annual report
Please find page 204 of the 2002 Honeywell annual report below. You can navigate through the pages in the report by either clicking on the pages listed below, or by using the keyword search tool below to find specific information within the annual report.-
 1
1 -
2
-
3
-
4
-
5
-
6
-
7
-
8
-
9
-
10
-
11
-
12
-
13
-
14
-
15
-
16
-
17
-
18
-
19
-
20
-
21
-
22
-
23
-
24
-
25
-
26
-
27
-
28
-
29
-
30
-
31
-
32
-
33
-
34
-
35
-
36
-
37
-
38
-
39
-
40
-
41
-
42
-
43
-
44
-
45
-
46
-
47
-
48
-
49
-
50
-
51
-
52
-
53
-
54
-
55
-
56
-
57
-
58
-
59
-
60
-
61
-
62
-
63
-
64
-
65
-
66
-
67
-
68
-
69
-
70
-
71
-
72
-
73
-
74
-
75
-
76
-
77
-
78
-
79
-
80
-
81
-
82
-
83
-
84
-
85
-
86
-
87
-
88
-
89
-
90
-
91
-
92
-
93
-
94
-
95
-
96
-
97
-
98
-
99
-
100
-
101
-
102
-
103
-
104
-
105
-
106
-
107
-
108
-
109
-
110
-
111
-
112
-
113
-
114
-
115
-
116
-
117
-
118
-
119
-
120
-
121
-
122
-
123
-
124
-
125
-
126
-
127
-
128
-
129
-
130
-
131
-
132
-
133
-
134
-
135
-
136
-
137
-
138
-
139
-
140
-
141
-
142
-
143
-
144
-
145
-
146
-
147
-
148
-
149
-
150
-
151
-
152
-
153
-
154
-
155
-
156
-
157
-
158
-
159
-
160
-
161
-
162
-
163
-
164
-
165
-
166
-
167
-
168
-
169
-
170
-
171
-
172
-
173
-
174
-
175
-
176
-
177
-
178
-
179
-
180
-
181
-
182
-
183
-
184
-
185
-
186
-
187
-
188
-
189
-
190
-
191
-
192
-
193
-
 194
194 -
 195
195 -
 196
196 -
 197
197 -
 198
198 -
 199
199 -
 200
200 -
 201
201 -
 202
202 -
 203
203 -
 204
204 -
 205
205 -
 206
206 -
 207
207 -
 208
208 -
 209
209 -
 210
210 -
 211
211 -
 212
212 -
 213
213 -
 214
214 -
215
-
216
-
217
-
218
-
219
-
220
-
221
-
222
-
223
-
224
-
225
-
226
-
227
-
228
-
229
-
230
-
231
-
232
-
233
-
234
-
235
-
236
-
237
-
238
-
239
-
240
-
241
-
242
-
243
-
244
-
245
-
246
-
247
-
248
-
249
-
250
-
251
-
252
-
253
-
254
-
255
-
256
-
257
-
258
-
259
-
260
-
261
-
262
-
263
-
264
-
265
-
266
-
267
-
268
-
269
-
270
-
271
-
272
-
273
-
274
-
275
-
276
-
277
-
278
-
279
-
280
-
281
-
282
-
283
-
284
-
285
-
286
-
287
-
288
-
289
-
290
-
291
-
292
-
293
-
294
-
295
-
296
-
297
 |
 |
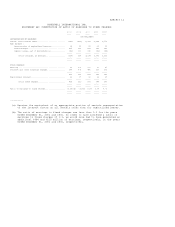
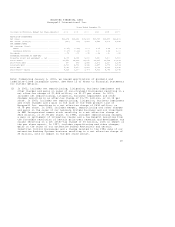
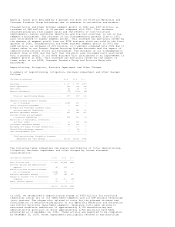
SELECTED FINANCIAL DATA
Honeywell International Inc.
Years Ended December 31,
---------------------------------------------------------
(Dollars in Millions, Except Per Share Amounts) 2002 2001 2000 1999 1998 1997
-----------------------------------------------------------------------------------------------------------
RESULTS OF OPERATIONS
Net sales ..................................... $22,274 $23,652 $25,023 $23,735 $23,555 $22,499
Net income (loss)(1)........................... (220) (99) 1,659 1,541 1,903 1,641
PER COMMON SHARE
Net earnings (loss):
Basic ...................................... (0.27) (0.12) 2.07 1.95 2.38 2.04
Assuming dilution .......................... (0.27) (0.12) 2.05 1.90 2.34 2.00
Dividends ..................................... 0.75 0.75 0.75 0.68 0.60 0.52
FINANCIAL POSITION AT YEAR-END
Property, plant and equipment -- net .......... 4,055 4,933 5,230 5,630 5,600 5,380
Total assets .................................. 27,559 24,226 25,175 23,527 22,738 20,118
Short-term debt ............................... 370 539 1,682 2,609 2,190 1,238
Long-term debt ................................ 4,719 4,731 3,941 2,457 2,776 2,394
Total debt .................................... 5,089 5,270 5,623 5,066 4,966 3,632
Shareowners' equity ........................... 8,925 9,170 9,707 8,599 8,083 6,775
===========================================================================================================
Note: Commencing January 1, 2002, we ceased amortization of goodwill and
indefinite-lived intangible assets. See Note 13 of Notes to Financial Statements
for further details.
(1) In 2002, includes net repositioning, litigation, business impairment and
other charges and gains on sales of non-strategic businesses resulting in a
net after-tax charge of $1,864 million, or $2.27 per share. In 2001,
includes net repositioning, litigation, business impairment and other
charges resulting in an after-tax charge of $1,771 million, or $2.18 per
share. In 2000, includes net repositioning, litigation, business impairment
and other charges and a gain on the sale of the TCAS product line of
Honeywell Inc. resulting in a net after-tax charge of $634 million, or
$0.78 per share. In 1999, includes merger, repositioning and other charges
and gains on the sales of our Laminate Systems business and our investment
in AMP Incorporated common stock resulting in a net after-tax charge of
$624 million, or $0.78 per share. In 1998, includes repositioning charges,
a gain on settlement of litigation claims and a tax benefit resulting from
the favorable resolution of certain prior-year research and development tax
claims resulting in a net after-tax charge of $4 million, with no impact on
the per share amount. In 1997, includes repositioning and other charges,
gains on the sales of our automotive Safety Restraints and certain
Industrial Control businesses and a charge related to the 1996 sale of our
automotive Braking Systems business resulting in a net after-tax charge of
$5 million, with no impact on the per share amount.
25