Honeywell 2002 Annual Report Download - page 274
Download and view the complete annual report
Please find page 274 of the 2002 Honeywell annual report below. You can navigate through the pages in the report by either clicking on the pages listed below, or by using the keyword search tool below to find specific information within the annual report.-
 1
1 -
2
-
3
-
4
-
5
-
6
-
7
-
8
-
9
-
10
-
11
-
12
-
13
-
14
-
15
-
16
-
17
-
18
-
19
-
20
-
21
-
22
-
23
-
24
-
25
-
26
-
27
-
28
-
29
-
30
-
31
-
32
-
33
-
34
-
35
-
36
-
37
-
38
-
39
-
40
-
41
-
42
-
43
-
44
-
45
-
46
-
47
-
48
-
49
-
50
-
51
-
52
-
53
-
54
-
55
-
56
-
57
-
58
-
59
-
60
-
61
-
62
-
63
-
64
-
65
-
66
-
67
-
68
-
69
-
70
-
71
-
72
-
73
-
74
-
75
-
76
-
77
-
78
-
79
-
80
-
81
-
82
-
83
-
84
-
85
-
86
-
87
-
88
-
89
-
90
-
91
-
92
-
93
-
94
-
95
-
96
-
97
-
98
-
99
-
100
-
101
-
102
-
103
-
104
-
105
-
106
-
107
-
108
-
109
-
110
-
111
-
112
-
113
-
114
-
115
-
116
-
117
-
118
-
119
-
120
-
121
-
122
-
123
-
124
-
125
-
126
-
127
-
128
-
129
-
130
-
131
-
132
-
133
-
134
-
135
-
136
-
137
-
138
-
139
-
140
-
141
-
142
-
143
-
144
-
145
-
146
-
147
-
148
-
149
-
150
-
151
-
152
-
153
-
154
-
155
-
156
-
157
-
158
-
159
-
160
-
161
-
162
-
163
-
164
-
165
-
166
-
167
-
168
-
169
-
170
-
171
-
172
-
173
-
174
-
175
-
176
-
177
-
178
-
179
-
180
-
181
-
182
-
183
-
184
-
185
-
186
-
187
-
188
-
189
-
190
-
191
-
192
-
193
-
194
-
195
-
196
-
197
-
198
-
199
-
200
-
201
-
202
-
203
-
204
-
205
-
206
-
207
-
208
-
209
-
210
-
211
-
212
-
213
-
214
-
215
-
216
-
217
-
218
-
219
-
220
-
221
-
222
-
223
-
224
-
225
-
226
-
227
-
228
-
229
-
230
-
231
-
232
-
233
-
234
-
235
-
236
-
237
-
238
-
239
-
240
-
241
-
242
-
243
-
244
-
245
-
246
-
247
-
248
-
249
-
250
-
251
-
252
-
253
-
254
-
255
-
256
-
257
-
258
-
259
-
260
-
261
-
262
-
263
-
 264
264 -
 265
265 -
 266
266 -
 267
267 -
 268
268 -
 269
269 -
 270
270 -
 271
271 -
 272
272 -
 273
273 -
 274
274 -
 275
275 -
 276
276 -
 277
277 -
 278
278 -
 279
279 -
 280
280 -
 281
281 -
 282
282 -
 283
283 -
 284
284 -
285
-
286
-
287
-
288
-
289
-
290
-
291
-
292
-
293
-
294
-
295
-
296
-
297
 |
 |
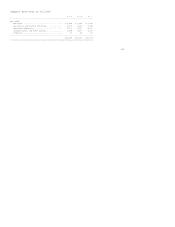
were $4,315, $4,036 and $3,109 million, respectively, at December 31, 2002 and
$1,296, $1,262 and $865 million, respectively, at December 31, 2001.
Due to the continued poor market performance of our pension fund assets and a
decline in the discount rate used to estimate our pension liabilities, we were
required to adjust the minimum pension liability recorded in our Consolidated
Balance Sheet at December 31, 2002. The effect of this adjustment was to
increase pension liabilities by $921 million (total minimum pension liability
included in other liabilities at December 31, 2002 was $1.2 billion), increase
intangible assets by $8 million, increase deferred income tax assets by $350
million, and increase accumulated other nonowner changes by $606 million ($956
million on a pretax basis).
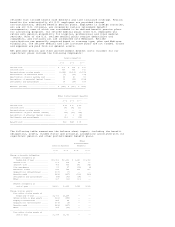
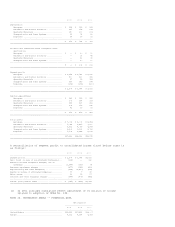
For measurement purposes, we assumed an annual healthcare cost trend rate of 9
percent for covered healthcare benefits in 2003. The rate was assumed to
decrease gradually to 5 percent in 2007 and remain at that level thereafter.
Assumed health-care cost trend rates have a significant effect on the amounts
reported for our retiree health-care plan. A one-percentage-point change in
assumed health-care cost trend rates would have the following effects:
One- One-
Percentage- Percentage-
Point Increase Point Decrease
--------------------------------------------------------------------------------
Effect on total of service and interest cost
components ................................ $ 9 $ (8)
Effect on postretirement benefit obligation... $124 $(111)
================================================================================
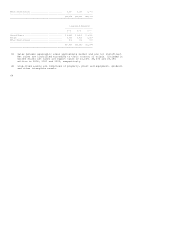
NOTE 23. SEGMENT FINANCIAL DATA
Statement of Financial Accounting Standards No. 131, "Disclosures about Segments
of an Enterprise and Related Information" (SFAS No. 131), establishes standards
for reporting information about operating segments. The following information is
provided in accordance with the requirements of SFAS No. 131 and is consistent
with how business results are reported internally to management.
We globally manage our business operations through strategic business units
(SBUs) serving customers worldwide with aerospace products and services,
control, sensing and security technologies for buildings, homes and industry,
automotive products and chemicals. Based on similar economic and operational
characteristics, our SBUs are aggregated into the following four reportable
segments:
o Aerospace includes Engines, Systems and Services (auxiliary power units;
propulsion engines; environmental control systems; engine controls; repair
and overhaul services; hardware; logistics and power generation systems);
Aerospace Electronic Systems (flight safety communications, navigation,
radar and surveillance systems; aircraft and airfield lighting; management
and technical services and advanced systems and instruments); and Aircraft
Landing Systems (aircraft wheels and brakes).
o Automation and Control Solutions includes Automation and Control Products
(controls for heating, cooling, indoor air quality, ventilation,
humidification and home automation; advanced software applications for
home/building control and optimization; sensors, switches, control systems
and instruments for measuring pressure, air flow, temperature, electrical
current and, security and fire detection, access control and video
surveillance systems); Service (installs, maintains and upgrades systems
that keep buildings safe, comfortable and productive); and Industry
Solutions (provides full range of automation and control solutions for
industrial plants, offering advanced software and automation systems that
integrate, control and monitor complex processes in many types of
industrial settings).
o Specialty Materials includes fibers; specialty films; intermediate
chemicals; fluorine-based products; pharmaceutical and agricultural
chemicals; specialty waxes, adhesives and sealants; process technology;
wafer fabrication materials and services; and amorphous metals.
o Transportation and Power Systems includes Garrett Engine Boosting Systems
(turbochargers and charge-air coolers); the Consumer Products Group (car
care products including anti-freeze, filters, spark plugs, cleaners, waxes
and additives); and Friction Materials (friction material and related brake
system components).
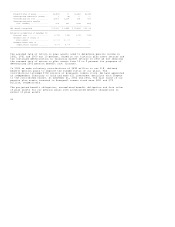
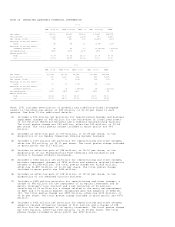
The accounting policies of the segments are the same as those described in Note
1. We evaluate segment performance based on segment profit, which excludes
general corporate unallocated expenses, gains (losses) on sales of non-strategic
businesses, equity income, other (income) expense, interest and other financial
charges and repositioning, litigation, business impairment and other charges.
Intersegment sales approximate market and are not significant. Reportable