HTC 2010 Annual Report Download - page 96
Download and view the complete annual report
Please find page 96 of the 2010 HTC annual report below. You can navigate through the pages in the report by either clicking on the pages listed below, or by using the keyword search tool below to find specific information within the annual report.-
 1
1 -
2
-
3
-
4
-
5
-
6
-
7
-
8
-
9
-
10
-
11
-
12
-
13
-
14
-
15
-
16
-
17
-
18
-
19
-
20
-
21
-
22
-
23
-
24
-
25
-
26
-
27
-
28
-
29
-
30
-
31
-
32
-
33
-
34
-
35
-
36
-
37
-
38
-
39
-
40
-
41
-
42
-
43
-
44
-
45
-
46
-
47
-
48
-
49
-
50
-
51
-
52
-
53
-
54
-
55
-
56
-
57
-
58
-
59
-
60
-
61
-
62
-
63
-
64
-
65
-
66
-
67
-
68
-
69
-
70
-
71
-
72
-
73
-
74
-
75
-
76
-
77
-
78
-
79
-
80
-
81
-
82
-
83
-
84
-
85
-
 86
86 -
 87
87 -
 88
88 -
 89
89 -
 90
90 -
 91
91 -
 92
92 -
 93
93 -
 94
94 -
 95
95 -
 96
96 -
 97
97 -
 98
98 -
 99
99 -
 100
100 -
 101
101
 |
 |

190 2 0 1 0 H T C A N N U A L R E P O R T 191
FINANCIAL INFORMATION
The fair values of financial instruments at fair value through profit or loss, available-for-sale and held-to-maturity financial assets are
based on quoted market prices in an active market, and their fair values can be reliably measured. If the securities do not have market
prices, fair value is measured on the basis of financial or other information. The Company uses estimates and assumptions that are
consistent with information that market participants would use in setting a price for these securities.
Financial assets carried at cost are investments in unquoted shares, which have no quoted prices in an active market and entail an
unreasonably high cost to obtain verifiable fair values. Therefore, no fair value is presented.
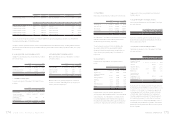
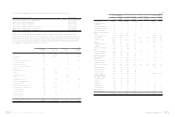
Methodology Used to Determine the Fair Values of Financial Instruments
Fair Values Based on Quoted Market Prices Fair Values Based on Valuation Methods
December 31 December 31
2009 2010 2009 2010
NT$ NT$ US$ (Note 3) NT$ NT$ US$ (Note 3)
Assets
Financial assets at fair value through profit or loss -
current $ 18,132 $ 450,276 $ 15,457 $ - $ - $ -
Available-for-sale financial assets - current 2,497,394 441,948 15,172 -- -
Available-for-sale financial assets - noncurrent 313 538 18 -- -
Held-to-maturity financial assets - noncurrent -207,467 7,122 -- -
Financial assets carried at cost -- - 565,172 1,023,661 35,141
There was no loss or gain recognized for the years ended December 31, 2009 and 2010 on the fair value changes of derivatives with
fair values estimated using valuation techniques. However, the Company recognized an unrealized loss of NT$26 thousand and an
unrealized gain of NT$773 thousand (US$27 thousand) under stockholders' equity for the changes in fair value of available-for-sale
financial assets for the years ended December 31, 2009 and 2010, respectively.
As of December 31, 2009 and 2010, financial assets exposed to fair value interest rate risk amounted to NT$0 thousand and
NT$207,946 thousand (US$7,139 thousand), respectively; financial assets exposed to cash flow interest rate risk amounted to
NT$62,609,630 thousand and NT$52,210,905 thousand (US$1,792,341 thousand), respectively, financial liabilities exposed to fair value
interest rate risk amounted to NT$46,875 thousand and NT$24,376 thousand (US$836 thousand), respectively.
Financial Risks
a. Market risk
The Company uses derivative contracts for hedging purposes, i.e., to reduce any adverse eect of exchange rate fluctuations of
accounts receivable/payable. The gains or losses on these contracts almost oset the gains or losses on the hedged items. Thus,
market risk is not material.
b. Credit risk
The Company deals only with banks with good credit standing based on the banks' reputation and takes into account past experience
with them. Moreover, the Company has a series of control procedures for derivative transactions. Management believes its exposure
to counter-parties' default on contracts is low.
c. Cash flow risk
The Company's operating funds are deemed sucient to meet the cash flow demand, therefore, liquidity risk is not considered to be
significant.
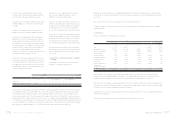
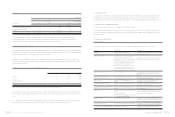
26. RELATED-PARTY TRANSACTIONS
The related parties were as follows:
Related Party Relationship with the Company
Xander International Corp. Chairperson is an immediate relative of the Company's chairperson
VIA Technologies, Inc. Same chairperson with HTC
Syuda Construction Company
The only juridical stockholder whose chairperson is the same person with the Company at
the transaction date
Chander Electronics Corp. Same chairperson with HTC
Way-Lien Technology Inc. Same chairperson with HTC
Captec Partners Management Corp. Main director is the chairperson of HTC
Comserve Network Netherlands B.V. Main director is an immediate relative of HTC's chairperson
Employees' Welfare Committee Employees' Welfare Committee of HTC
HTC Cultural and Educational Foundation
A non-profit organization of which the funds donated from the Company exceeds one third
of the non-profit organization's total funds
HTC Social Welfare and Charity Foundation
A non-profit organization of which the funds donated from the Company exceeds one third
of the non-profit organization's total funds
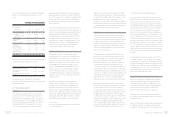
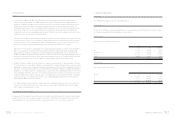
Major transactions with related parties are summarized below:
Purchases of Inventories and Services
2009 2010
Related Party Amount
% to Total Net
Purchases Amount
% to Total Net
Purchases
NT$ NT$ US$ (Note 3)
Chander Electronics Corp. 28,606 - 270,931 9,301 -
Terms of payment and purchasing prices for both related and third parties were similar.
Sales and Services Provided
2009 2010
Related Party Amount % to Total Revenues Amount % to Total Revenues
NT$ NT$ US$ (Note 3)
Employees' Welfare Committee $ 9,666 $ 34,138 $ 1,172
VIA Technologies, Inc. 794 - 2,353 81 -
Others 714 - 1,701 58 -
$ 11,174 - $ 38,192 $ 1,311 -