HTC 2010 Annual Report Download - page 95
Download and view the complete annual report
Please find page 95 of the 2010 HTC annual report below. You can navigate through the pages in the report by either clicking on the pages listed below, or by using the keyword search tool below to find specific information within the annual report.-
 1
1 -
2
-
3
-
4
-
5
-
6
-
7
-
8
-
9
-
10
-
11
-
12
-
13
-
14
-
15
-
16
-
17
-
18
-
19
-
20
-
21
-
22
-
23
-
24
-
25
-
26
-
27
-
28
-
29
-
30
-
31
-
32
-
33
-
34
-
35
-
36
-
37
-
38
-
39
-
40
-
41
-
42
-
43
-
44
-
45
-
46
-
47
-
48
-
49
-
50
-
51
-
52
-
53
-
54
-
55
-
56
-
57
-
58
-
59
-
60
-
61
-
62
-
63
-
64
-
65
-
66
-
67
-
68
-
69
-
70
-
71
-
72
-
73
-
74
-
75
-
76
-
77
-
78
-
79
-
80
-
81
-
82
-
83
-
84
-
 85
85 -
 86
86 -
 87
87 -
 88
88 -
 89
89 -
 90
90 -
 91
91 -
 92
92 -
 93
93 -
 94
94 -
 95
95 -
 96
96 -
 97
97 -
 98
98 -
 99
99 -
 100
100 -
 101
101
 |
 |

188 2 0 1 0 H T C A N N U A L R E P O R T 189
FINANCIAL INFORMATION
For distribution of earnings generated on or after January 1, 1998, the ratio for the imputation credits allocated to stockholders of
the Company is based on the balance of the ICA as of the date of dividend distribution. The expected creditable ratio for the 2010
earnings may be adjusted, depending on the ICA balance on the date of dividend distribution.
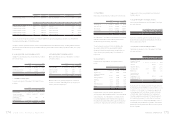
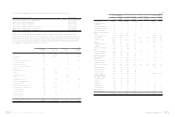
24. EARNINGS PER SHARE
Earnings per share (EPS) before tax and after tax are calculated by dividing net income by the weighted average number of common
shares outstanding which includes the deduction of the eect of treasury stock during each year. The weighted average number of
shares used in EPS calculation was 826,735 thousand shares and 815,239 thousand shares for the years ended December 31, 2009 and
2010, respectively. EPS for the year ended December 31, 2009 was calculated after the average number of shares outstanding was
adjusted retroactively for the eect of stock dividend distribution in 2010.
The Accounting Research and Development Foundation issued Interpretation 2007-052 that requires companies to recognize bonuses
paid to employees, directors and supervisors as compensation expenses beginning January 1, 2008. These bonuses were previously
recorded as appropriations from earnings. If the Company may settle the bonus to employees by cash or shares, the Company should
presume that the entire amount of the bonus will be settled in shares and the resulting potential shares should be included in the
weighted average number of shares outstanding used in the calculation of diluted EPS, if the shares have a dilutive eect. The number
of shares is estimated by dividing the entire amount of the bonus by the closing price of the shares at the balance sheet date. Such
dilutive eects of the potential shares needs to be included in the calculation of diluted EPS until the stockholders resolve the number
of shares to be distributed to employees at their meeting in the following year. The related EPS information for the years ended
December 31, 2009 and 2010 were as follows:
2009
Amount (Numerator) EPS (In Dollars)
Before Income Tax
After Income
Tax
Shares
(Denominator)
(In Thousands) Before Income Tax
After Income
Tax
NT$ NT$ NT$ NT$
Basic EPS $ 25,212,464 $ 22,608,902 826,735 $ 30.50 $ 27.35
Bonus to employees - - 15,044
Diluted EPS $ 25,212,464 $ 22,608,902 841,779 $ 29.95 $ 26.86
2010
Amount (Numerator) EPS (In Dollars)
Before Income Tax
After Income
Tax
Shares
(Denominator)
(In Thousands) Before Income Tax
After Income
Tax
NT$ NT$ NT$ NT$
Basic EPS $ 44,491,309 $ 39,533,600 815,239 $ 54.57 $ 48.49
Bonus to employees - - 10,201
Diluted EPS $ 44,491,309 $ 39,533,600 825,440 $ 53.90 $ 47.89
2010
Amount (Numerator) EPS (In Dollars)
Before Income Tax
After Income
Tax
Shares
(Denominator)
(In Thousands) Before Income Tax
After Income
Tax
US$ (Note 3) US$ (Note 3) US$ (Note 3) US$ (Note 3)
Basic EPS $ 1,527,366 $ 1,357,143 815,239 $ 1.87 $ 1.66
Bonus to employees - - 10,201
Diluted EPS $ 1,527,366 $ 1,357,143 825,440 $ 1.85 $ 1.64
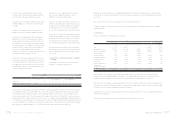
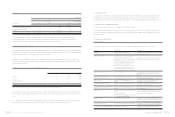
25. FINANCIAL INSTRUMENTS
Fair Value of Financial Instruments
a. Nonderivative financial instruments
December 31
2009 2010
Carrying
Amount Fair Value
Carrying
Amount Fair Value
NT$ NT$ NT$ US$ (Note 3) NT$ US$ (Note 3)
Assets
Available-for-sale financial assets - current $ 2,497,394 $ 2,497,394 $ 441,948 $ 15,172 $ 441,948 $ 15,172
Available-for-sale financial assets - noncurrent 313 313 538 18 538 18
Held-to-maturity financial assets - noncurrent - - 207,946 7,139 207,467 7,122
Financial assets carried at cost 565,172 565,172 1,023,661 35,141 1,023,661 35,141
b. Derivative financial instruments
December 31
2009 2010
Carrying
Amount Fair Value
Carrying
Amount Fair Value
NT$ NT$ NT$ US$ (Note 3) NT$ US$ (Note 3)
Assets
Financial assets at fair value through
profit or loss - current $ 18,132 $ 18,132 $ 450,276 $ 15,457 $ 450,276 $ 15,457
Methods and Assumptions Used in Determining Fair Values of Financial Instruments
Not subject to Statement of Financial Accounting Standards No. 34 - “Financial Instruments: Recognition and Measurement” are
cash, receivables, other current financial assets, payables, accrued expenses and other current financial liabilities, which have carrying
amounts that approximate their fair values.
The financial instruments include neither refundable deposits nor guarantee deposits. The fair values of refundable deposits and
guarantee deposits received are based on the present value of future cash flows discounted at the average interest rates for time
deposits with maturities similar to those of the financial instruments.