HTC 2010 Annual Report Download - page 70
Download and view the complete annual report
Please find page 70 of the 2010 HTC annual report below. You can navigate through the pages in the report by either clicking on the pages listed below, or by using the keyword search tool below to find specific information within the annual report.-
 1
1 -
2
-
3
-
4
-
5
-
6
-
7
-
8
-
9
-
10
-
11
-
12
-
13
-
14
-
15
-
16
-
17
-
18
-
19
-
20
-
21
-
22
-
23
-
24
-
25
-
26
-
27
-
28
-
29
-
30
-
31
-
32
-
33
-
34
-
35
-
36
-
37
-
38
-
39
-
40
-
41
-
42
-
43
-
44
-
45
-
46
-
47
-
48
-
49
-
50
-
51
-
52
-
53
-
54
-
55
-
56
-
57
-
58
-
59
-
 60
60 -
 61
61 -
 62
62 -
 63
63 -
 64
64 -
 65
65 -
 66
66 -
 67
67 -
 68
68 -
 69
69 -
 70
70 -
 71
71 -
 72
72 -
 73
73 -
 74
74 -
 75
75 -
 76
76 -
 77
77 -
 78
78 -
 79
79 -
 80
80 -
81
-
82
-
83
-
84
-
85
-
86
-
87
-
88
-
89
-
90
-
91
-
92
-
93
-
94
-
95
-
96
-
97
-
98
-
99
-
100
-
101
 |
 |

138 2 0 1 0 H T C A N N U A L R E P O R T 139
FINANCIAL INFORMATION
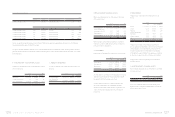
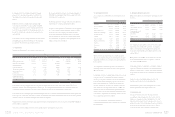
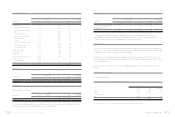
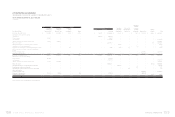
Deductible temporary dierences and tax credit carryforwards that gave rise to deferred tax assets as of December 31, 2009 and 2010
were as follows:
2009 2010
NT$ NT$ US$(Note 3)
Temporary dierences
Provision for loss on decline in value of inventory $ 529,353 ) $ 584,238 $ 20,056
Unrealized marketing expenses 1,714,593 2,676,285 91,874
Unrealized reserve for warranty expense 1,057,512 1,539,698 52,856
Capitalized expense 40,734 74,045 2,542
Unrealized royalties 1,691,142 2,879,421 98,847
Unrealized contingent losses of purchase orders 95,699 206,795 7,099
Unrealized bad-debt expenses 147,309 64,353 2,209
Unrealized exchange losses, net 155,801 30,472 1,046
Other 43,237 12,570 432
Tax credit carryforwards 3,056,328 3,141,129 107,832
Total deferred tax assets 8,531,708 11,209,006 384,793
Less: Valuation allowance ( 6,623,210 ) ( 7,760,428 ) ( 266,407 )
Total deferred tax assets, net 1,908,498 3,448,578 118,386
Deferred tax liabilities
Unrealized pension cost ( 27,531 ) ( 27,021 ) ( 928 )
Unrealized valuation gains on financial instruments ( 3,626 ) ( 76,547 ) ( 2,628 )
1,877,341 3,345,010 114,830
Less: Current portion ( 811,240 ) ( 925,579 ) ( 31,774 )
Deferred tax assets - noncurrent
$
1,066,101 $ 2,419,431 $ 83,056
Details of the tax credit carryforwards were as follows:
2009 2010
Year of Occurrence Validity Period NT$ NT$ US$(Note 3)
Temporary dierences
2007 2007-2011 $ 201,506 $ - $ -
2008 2008-2012 831,154 831,154 28,533
2009 2009-2013 2,023,668 2,309,975 79,299
$ 3,056,328 $ 3,141,129 $ 107,832
Before January 1, 2010, the investment and research and development tax credits can be carried forward for four years based on the
related regulations of Income Tax Act in the ROC. The total credits used in each year cannot exceed half of the estimated income tax
provision.
Under Article 10 of the Statute for Industrial Innovation (SII) passed by the Legislative Yuan in April 2010, a profit-seeking enterprise
may deduct up to 15% of its research and development expenditures from its income tax payable for the fiscal year in which these
expenditures are incurred, but this deduction should not exceed 30% of the income tax payable for that fiscal year. This incentive took
eect from January 1, 2010 and is eective till December 31, 2019.
Valuation allowance is based on management’s evaluation of the amount of tax credits that can be carried forward for four years.
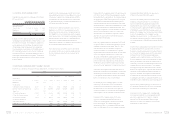
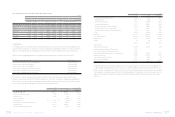
The income taxes in 2009 and 2010 were as follows:
2009 2010
NT$ NT$ US$(Note 3)
Current income tax $ 3,211,563 $ 6,330,018 $ 217,303
Increase in deferred income tax assets ( 503,703) ( 1,467,669) ( 50,384)
(Overestimation) underestimation of prior year’s income tax ( 104,298) 95,360 3,274
Income tax $ 2,603,562 $ 4,957,709 $ 170,193
The integrated income tax information is as follows:
2009 2010
NT$ NT$ US$(Note 3)
Balance of imputation credit account (ICA) $ 1,702,246 $ 3,098,652 $ 106,373
Unappropriated earnings generated from 1998 38,364,099 52,876,892 1,815,204
Actual/estimated creditable ratio (including income tax payable) 13.85% 18.00% 18.00%
(Actual ratio) (Estimated ratio) (Estimated ratio)
For distribution of earnings generated on or after January 1, 1998, the ratio for the imputation credits allocated to stockholders of
the Company is based on the balance of the ICA as of the date of dividend distribution. The expected creditable ratio for the 2010
earnings may be adjusted, depending on the ICA balance on the date of dividend distribution.
22. EARNINGS PER SHARE
Earnings per share (EPS) before tax and after tax are calculated by dividing net income by the weighted average number of common
shares outstanding which includes the deduction of the eect of treasury stock during each year. The weighted average number of
shares used in EPS calculation was 826,735 thousand shares and 815,239 thousand shares for the years ended December 31, 2009 and
2010, respectively. EPS for the year ended December 31, 2009 was calculated after the average number of shares outstanding was
adjusted retroactively for the eect of stock dividend distribution in 2010.
The Accounting Research and Development Foundation issued Interpretation 2007-052 that requires companies to recognize bonuses
paid to employees, directors and supervisors as compensation expenses beginning January 1, 2008. These bonuses were previously
recorded as appropriations from earnings. If the Company may settle the bonus to employees by cash or shares, the Company should
presume that the entire amount of the bonus will be settled in shares and the resulting potential shares should be included in the
weighted average number of shares outstanding used in the calculation of diluted EPS, if the shares have a dilutive eect. The number
of shares is estimated by dividing the entire amount of the bonus by the closing price of the shares at the balance sheet date. Such
dilutive eects of the potential shares needs to be included in the calculation of diluted EPS until the stockholders resolve the number
of shares to be distributed to employees at their meeting in the following year. The related EPS information for the years ended
December 31, 2009 and 2010 were as follows: