HTC 2010 Annual Report Download - page 78
Download and view the complete annual report
Please find page 78 of the 2010 HTC annual report below. You can navigate through the pages in the report by either clicking on the pages listed below, or by using the keyword search tool below to find specific information within the annual report.-
 1
1 -
2
-
3
-
4
-
5
-
6
-
7
-
8
-
9
-
10
-
11
-
12
-
13
-
14
-
15
-
16
-
17
-
18
-
19
-
20
-
21
-
22
-
23
-
24
-
25
-
26
-
27
-
28
-
29
-
30
-
31
-
32
-
33
-
34
-
35
-
36
-
37
-
38
-
39
-
40
-
41
-
42
-
43
-
44
-
45
-
46
-
47
-
48
-
49
-
50
-
51
-
52
-
53
-
54
-
55
-
56
-
57
-
58
-
59
-
60
-
61
-
62
-
63
-
64
-
65
-
66
-
67
-
 68
68 -
 69
69 -
 70
70 -
 71
71 -
 72
72 -
 73
73 -
 74
74 -
 75
75 -
 76
76 -
 77
77 -
 78
78 -
 79
79 -
 80
80 -
 81
81 -
 82
82 -
 83
83 -
 84
84 -
 85
85 -
 86
86 -
 87
87 -
 88
88 -
89
-
90
-
91
-
92
-
93
-
94
-
95
-
96
-
97
-
98
-
99
-
100
-
101
 |
 |

154 2 0 1 0 H T C A N N U A L R E P O R T 155
FINANCIAL INFORMATION
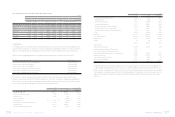
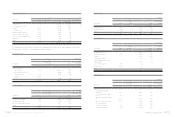
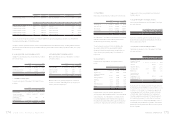
HTC CORPORATION AND SUBSIDIARIES
CONSOLIDATED BALANCE SHEETS
DECEMBER 31, 2009 AND 2010
(In Thousands, Except Par Value)
2009 2010
ASSETS NT$ NT$ US$(Note3)
CURRENT ASSETS
Cash and cash equivalents (Notes 2 and 4) $ 64,638,290 $ 74,462,861 $ 2,556,226
Financial assets at fair value through profit or loss (Notes 2, 5 and 25) 18,132 450,276 15,457
Available-for-sale financial assets - current (Notes 2 and 6) 2,497,394 441,948 15,172
Notes and accounts receivable, net (Notes 2, 7 and 26) 27,125,609 61,614,355 2,115,151
Other current financial assets (Notes 8 and 26) 258,474 783,540 26,898
Inventories (Notes 2 and 9) 6,036,207 26,413,747 906,754
Prepayments (Note 10) 3,341,649 2,653,778 91,101
Deferred income tax assets (Notes 2 and 23) 812,254 1,051,196 36,086
Other current assets 172,872 767,825 26,359
Total current assets 104,900,881 168,639,526 5,789,204
LONG-TERM INVESTMENTS
Available-for-sale financial assets - noncurrent (Notes 2 and 6) 313 538 18
Held-to-maturity financial assets - noncurrent (Notes 2 and 11) -207,946 7,139
Financial assets carried at cost (Notes 2 and 12) 565,172 975,596 33,491
Prepayments for long-term investments (Notes 2, 12 and 13) 245,000 48,065 1,650
Total long-term investments 810,485 1,232,145 42,298
PROPERTIES (Notes 2, 14 and 26)
Cost
Land 4,719,538 5,862,076 201,238
Buildings and structures 4,218,443 5,005,642 171,838
Machinery and equipment 4,702,420 7,236,349 248,416
Molding equipment 199,392 172,632 5,926
Computer equipment 411,504 474,299 16,282
Transportation equipment 4,575 7,378 253
Furniture and fixtures 462,664 245,041 8,412
Leased assets 6,327 5,934 204
Leasehold improvements 199,416 305,073 10,473
Total cost 14,924,279 19,314,424 663,042
Less: Accumulated depreciation ( 5,055,135) ( 5,801,233) ( 199,150)
Prepayments for construction-in-progress and equipment-in-transit 30,664 511,138 17,547
Properties, net 9,899,808 14,024,329 481,439
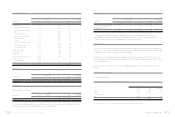
INTANGIBLE ASSETS (Note 2)
Patents -208,581 7,160
Goodwill 239,992 497,803 17,089
Deferred pension cost 490 416 14
Other -228,850 7,857
Total intangible assets 240,482 935,650 32,120
OTHER ASSETS
Assets leased to others 48,135 50,828 1,745
Refundable deposits 128,655 150,860 5,179
Deferred charges (Note 2) 245,996 243,249 8,350
Deferred income tax assets (Notes 2 and 23) 1,067,691 2,366,488 81,239
Restricted assets (Note 27) 106,252 95,688 3,285
Other (Notes 2, 10 and 19) 1,980,632 2,642,981 90,731
Total other assets 3,577,361 5,550,094 190,529
TOTAL $ 119,429,017 $ 190,381,744 $ 6,535,590
2009 2010
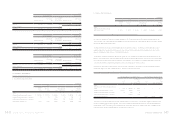
LIABILITIES AND STOCKHOLDERS’ EQUITY NT$ NT$ US$(Note3)
CURRENT LIABILITIES
Short-term borrowings (Note 15) $ 72,326 $ - $ -
Notes and accounts payable (Note 26) 25,631,015 63,916,803 2,194,192
Income tax payable (Notes 2 and 23) 4,270,962 6,809,417 233,760
Accrued expenses (Notes 16 and 26) 16,963,888 33,426,028 1,147,478
Payable for purchase of equipment (Note 26) 153,551 441,976 15,173
Long-term liabilities - current portion (Note 18) 22,500 12,188 418
Other current liabilities (Notes 17 and 26) 6,614,533 11,034,691 378,808
Total current liabilities 53,728,775 115,641,103 3,969,829
LONG-TERM LIABILITIES
Long-term bank loans, net of current portion (Note 18) 24,375 12,188 418
OTHER LIABILITIES
Guarantee deposits received 1,210 13,959 479
Total liabilities 53,754,360 115,667,250 3,970,726
STOCKHOLDERS’ EQUITY (Note 20)
Capital stock - NT$10.00 par value
Authorized: 1,000,000 thousand shares
Issued and outstanding: 788,936 thousand shares in 2009 and
817,653 thousand shares in 2010
Common stock 7,889,358 8,176,532 280,691
Capital surplus
Additional paid-in capital from share issuance in excess of par 9,056,323 10,777,623 369,984
Long-term equity investments 18,411 18,411 632
Merger 25,189 24,710 848
Retained earnings
Legal reserve 10,273,674 10,273,674 352,684
Accumulated earnings 38,364,099 52,876,892 1,815,204
Cumulative translation adjustments (Note 2) 15,088 ( 579,849) ( 19,906)
Net loss not recognized as pension cost ( 34) ( 121) ( 4)
Unrealized valuation losses on financial instruments ( 1,658) ( 885) ( 30)
Treasury stock (Notes 2 and 21) -( 6,852,493) ( 235,239)
Equity attributable to stockholders of the parent 65,640,450 74,714,494 2,564,864
MINORITY INTEREST 34,207 - -
Total stockholders' equity 65,674,657 74,714,494 2,564,864
TOTAL $ 119,429,017 $ 190,381,744 $ 6,535,590